
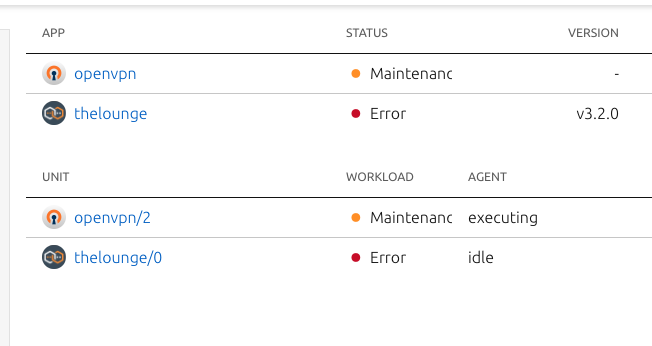
I unfortunately only managed to click twice before hitting an error and filed a bug: https://github.com/canonical-web-and-design/jaas-dashboard/issues/524
I have another post coming along with the release of Juju 2.8 which explains some of this in more detail but I can reply to your comments here too ![]()
The Dashboard is a change in direction from the outgoing GUI which was focused on the deployment of models and viewing a single model at a time. The new Dashboard is focused on the operations and observability of your Juju models across one or more controllers. As your number of models, applications, machines, etc increase, the usefulness of the new Dashboard does as well.
What you’re seeing so far is still very much a beta, we’re working fast to expand the available features.
Unfortunately true, another team is working on getting this ready to be released. We’ll definitely keep everyone updated as we want to see it in there as much as anyone ![]()
We’re actively working on expanding the feature set here and would love to hear what kind of features you’d like to see. We have a few different ideas and features that we’ll be posting to discourse here to gain feedback.
This is great feedback, I’ll bring this back to the team and see how we might integrate viewing the configuration values in here.
One of my teammates is currently working on adding the ability to reposition the application icons on the topology so you should see that in the near future.
I hope my replies assuage your concerns a bit and that you’ll give us a bit more time before writing it off ![]()
2 Likes
On top of what Jeff said, another point to make is that it’s a live status of all your models. The main focus is exactly to provide a wider view and control of all models and controllers running on enterprise environment. From that top-view it’s then possible to go on model level and debug. Unfortunately the shell needs some more work and has been temporarily removed. The idea is that users can debug and act on their models directly on the browser, without leaving the Dashboard, and have the UI interacting with the Shell.
We are working and iterating on adding more features, coming next: ssh to machines, machines detailed view, charm actions, Juju logs… feedback like this will help us to focus on user’s requests and align priorities to improve the Dashboard. Thank you for your inputs 
2 Likes
The new gui is looking awesome! Was poking around and noticed a visual gotcha:
The column spacing for the “App” header gives it plenty of extra room, all the while the status column is truncated.
Thanks
1 Like
Thank you @jamesbeedy! Forwarding the visual bug to the team
1 Like
I love the new dash, and I miss the old GUI, so can I have both at once?
To be clear, I really find the visual config useful personally. Not that I’m afraid of the CLI, but sometimes it’s just a better way to visualize settings in context. Also, to be able to browse the catalog at the same time is valuable to me.
2 Likes
I second this - the new GUI is a great addition, but it is a HUGE step back in terms of functionality. I understand that the old GUI replicates a lot of the functionality on the cli, but it’s vastly more convenient and intuitive. A new GUI needs to at least reach feature-parity before becoming the only option - please implement some ability for us to run the old juju-gui alongside the new dashboard.
2 Likes
I think that would be a welcome feature. I have a colleague who was using the old version of Juju at one point and was relieved to be using the old GUI for a second.
If you want to, you can try out Juju lens which has support for viewing and changing config:
Thanks! I’m glad you like it.
We’re working hard to add back some of the most highly requested features and the “configuration interactions” are high on that list. We don’t currently have any plans to integrate charm browsing back in as we had in the old GUI.
We have our roadmap planning coming up soon so I’ll be sure to get the configuration interactions on that list.
Unfortunately our team is quite small so we don’t have the resources to be able to support both UI’s at the same time. As I mentioned above we are working hard to add the most requested features back in while also staying true to the vision of the new dashboard. I’d love to hear what features you’d like to see implemented so that we can prioritize accordingly.
And if either of you would like to be involved in the research and testing phase of the dashboard or would just like to request features feel free to PM me or fill out the Canonical User Interview Group form. We’d love your feedback.
2 Likes
Thanks @hatch for the update.
Out of interest, is it not expected that users would discover charms in the catalog? Are you, for example more expecting Juju users to be authoring their own Charms that never get published to the store?
Ahh no most certainly not. For now we would direct you to the store outside of the GUI to explore the available charms.
Over the years what we’ve found is that people spend the vast majority of their time with Juju in the “operations & monitoring” phase and little in the actual “discovery & deployment” phase. That is after all one of the strong points of Juju is how easy deployment and operations is.
So with the new dashboard we’re first focusing on that majority use case and then after we have that settled we can start evaluating other integrations.
As a little sneak peek, coming with Juju 2.9 there will be the re-introduction of the Juju CLI in the dashboard so you’ll again be able to perform ‘write’ operations (ACL permitting of course) like deploy, relate, config etc.
2 Likes
I would certainly agree, and begrudgingly acknowledge that the lack of attention in the D&D phase is quite evident - the catalog seems lacking in several areas, but that’s a topic for another thread methinks ![]()
1 Like
We’ve got some big things coming in that area so keep your eyes pealed ![]()
5 Likes
Is there an easy way to revert?
1 Like
Unfortunately, no. The only ways to use the old GUI now are:
1 Like
What features are you looking for in the old GUI that are missing from the new Dashboard? We’re currently planning our next cycle of work so we’ll have an updated roadmap shortly and can take any feedback into consideration.
1 Like
I want to simply run openstack base with one modification (ceph as directory NOT as /dev/sdb). It states in old config I can do so on old JAAS.ai dashboard. it would be 2 seconds to change in the old one, where I wouldnt have to download a YAML, modify it and get back to doing work.
I am not unwilling mind you, just it increases steps.
SO it is a sweeping change? I am running juju on a testbed, have it gapped and dont want to make it routable.
I think you might be able to build the old GUI from source and then copy it inside your gapped environment and run it there, but @hatch would have to let you know how to do that, as I’ve never done it before.
If you just want to be able to change config on your applications through a GUI you can use Juju Lens, which has both a web application and desktop application which you can use without having to deploy anything or change your controller at all. It’s super easy to try out.
1 Like
I love that concept app very much, but it is not successfully loading my controller/models. I will play with it a bit more! 
UPDATE:
I am using conjure-up again for a run through to use (same of course as running the model directly). I have successfully modified the field in question. Now I am simply waiting for it to complete. I am in NO way criticizing. These tools are amazing and I am grateful.
3 Likes