JAAS Dashboard, the new Juju GUI
The Juju UI team who previously developed and maintained the Juju GUI have taken a measured shift in direction.
The GUI had many features from a drag-and-drop relation creation, unit placement, etc. which the team were proud to demonstrate and show off the power of the UI. Unfortunately, the usage of these features was limited in practice and in truth, a lot of these features were achievable easily via the CLI.
What is the JAAS Dashboard
The JAAS dashboard is a brand-new UI. Built from the ground up to provide only the best features a UI can provide over the CLI. The idea is to aid users of Juju instead of providing another way of using the Juju tool and ecosystem.
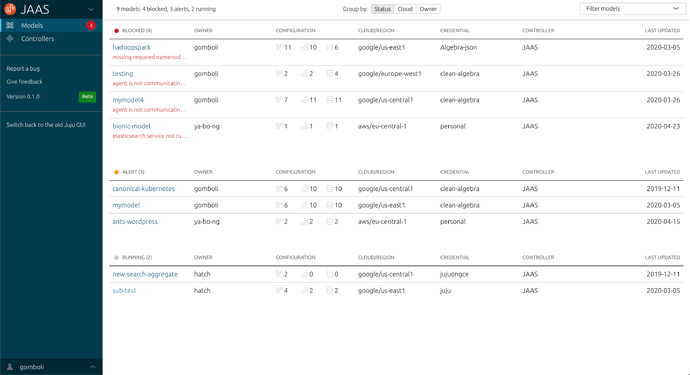
The main view is the model list which provides an at a glance overview of the status of your systems. This is something the CLI cannot provide without switching between models and collecting their status, an experience especially tailored for enterprises.
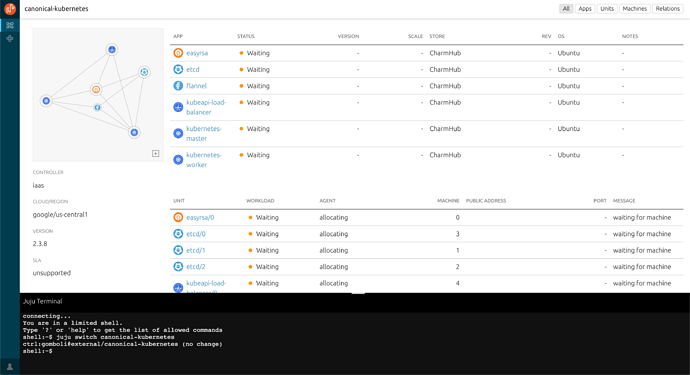
The model view is a super-powered status output with advanced filtering capabilities and errors being surfaced in real-time. We also included a slimmed-down version of the visual topology representation of your environments.
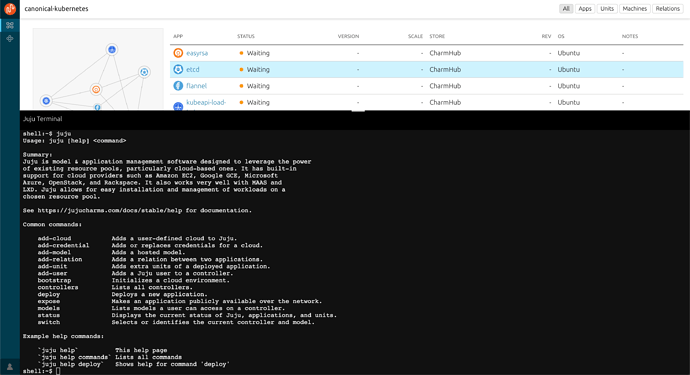
The dashboard still provides you with a way to interact with your systems via a fully-featured web CLI. When viewing any model you are automatically given access to the CLI, accessible via a full-width panel at the bottom of the page. Allowing you to run any Juju commands you have access to within that model.
Watch this space
The Juju UI team are rapidly working on improvements and new features. Maintaining the mantra to provide features that are complementary to the awesome Juju tool. With the help from our friends working on Juju, we aim to make the dashboard a first-class citizen within Juju and its ecosystem.
Try it out and please provide us with feedback:
JAAS Dashboard
Provide feedback here on Discourse or report a bug
The team: @anthonydillon @hatch @barry-mcgee @cristinadresch @ziheliu214 @gomboli


