Hello everyone,
We started exploring a new “machines view” for the JAAS/Juju Dashboard and we would like to share this with you to gather some feedback and comments.
If you are on Zeplin, you can also comment in there: https://zpl.io/VDJPWlW
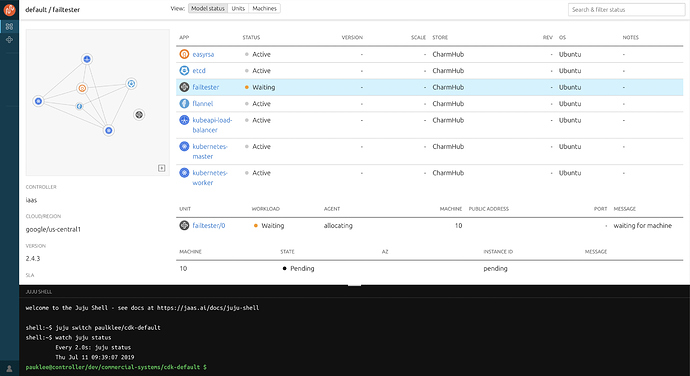
The model detail page of the Dashboard lists the live-updated juju status output and users can manipulate it by filtering the content (e.g. clicking on an application to highlight the relevant units and machines) and input commands in the Juju Shell.
As a follow up of this experience this cycle we are working on new main features among smaller ones:
- SSH to machine
- Actions
- Logs
- Configuration
This topic is about the machines view.
An exploration of the ‘machines view’
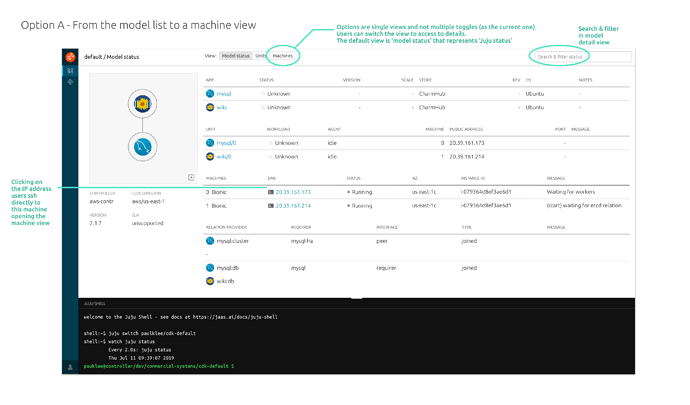
From the model detail page, clicking on the DNS of the machine, users go to the machines view and SSH to that machine:
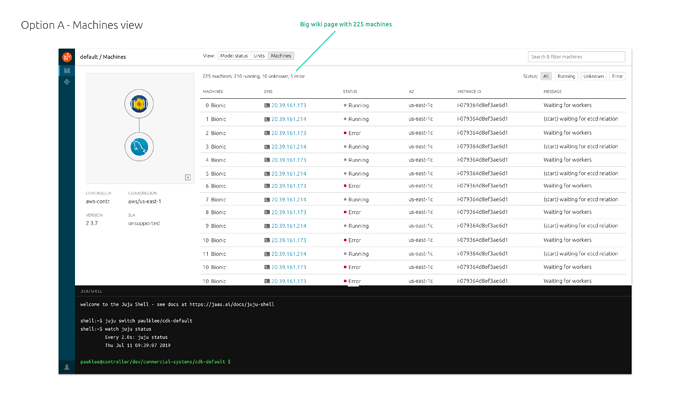
We are working with large-model use cases for enterprises with hundreds or thousands units and machines within a model. For this reason we included in this view the same UI used in the model list view: summary of the list, ability to filter the status of the machine, and a dedicated advance search & filter.
We would list all the machines of a model under its own “Machines view”, where users can SSH to a particular one:
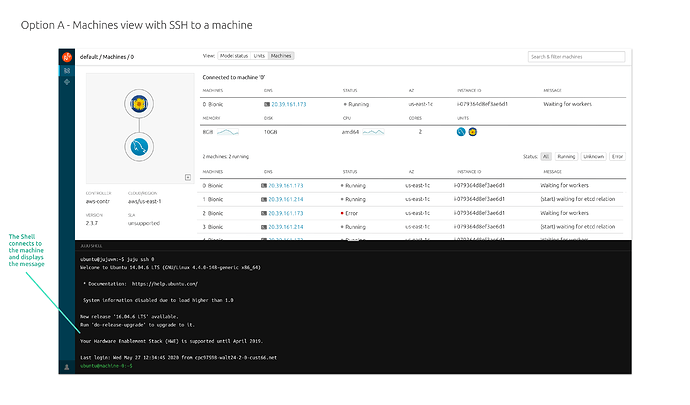
SSH view, clicking on the DNS/icon (also doable from the Shell with juju ssh 0):
Connecting to the SSH also surfaces more information about that machine: what units are on there, its configuration (constraints), and performances.
Would be great to get your feedback on this initial exploration.
Thank you,
Claudio


