Monitoring (COS)
The Canonical Observability Stack (COS) is a set of tools that facilitates gathering, processing, visualizing, and setting up alerts on telemetry signals generated by workloads in and outside of Juju.
The OpenSearch Dashboards charm can use COS to connect to Grafana and Prometheus to use monitoring, alert rules, and log features.
See: How to enable monitoring via COS and Grafana
Summary
Metrics
The Prometheus exporter is automatically installed by the OpenSearch Dashboards snap using: The Prometheus Exporter for OpenSearch Dashboards
The meaning of the metrics collected can be found in the README of the exporter.
To ensure you are referencing the latest default alert rules, check the source file of alert definitions in the repository’s prometheus_alerts.yaml file
Default alert rules
| Alert | Severity | Notes |
|---|---|---|
| OpenSearchDashboardsScrapeFailed | Triggered when the prometheus scrape fails. | |
| OpenSearchDashboardsRed | OpenSearch Dashboards status can turn red for the following reasons:
|
|
| OpenSearchDashboardsYellow | Triggered when OpenSearch Dashboards is yellow. Dashboard plugins might be degraded or shards may be relocating or initializing | |
| OpenSearchDashboardsPluginRed | Triggered when OpenSearch Dashboards plugin or core component are in red state | |
| OpenSearchDashboardsPluginYellow | Triggered when OpenSearch Dashboards plugin or core component are in yellow state | |
| OpenSearchDashboardsNoMetrics | Triggered when exporter failed to collect status metrics. | |
| OpenSearchDashboardsLongResponseTime | Triggered when the server is up and responsive, however with a high latency. |
Logs
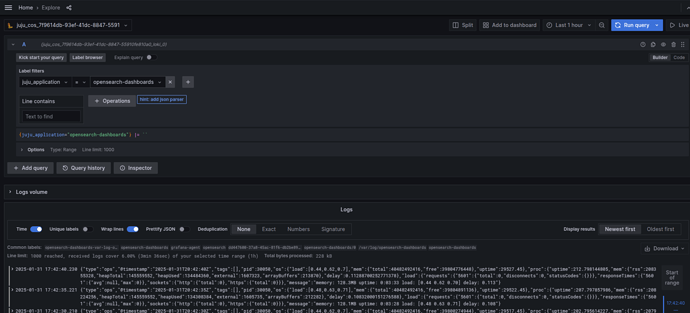
All the logs from the OpenSearch Dashboards payload are available in the Grafana web interface at Home > Explore
To get OpenSearch Dashboards logs, go to the Label filters field and set to juju_application = opensearch-dashboards, select one operation, e.g. Line contains and run the query.
