
Hello everybody out there using Juju -
I’m doing a (free) juju-related tool (just a hobby, wont’ be big and professional like Juju) for AMD64 and ARM64 clones. This has been brewing since March, and it is starting to get ready. I’d like any feedback on things people like/dislike in Juju tools, as my tool resembles it somewhat…[1]
Just over a month ago, I posted about my experience developing JujuMate from scratch with the help of the Anthropic’s Opus 4.6 model using Copilot CLI.
Since that post over a month ago, I’ve continued working on JujuMate in my spare time; it’s now at version 0.4.0, and I’d like to take this opportunity to share some of the things we can do with JujuMate and what (for now) we can’t do.
In the beginning… there was the command line
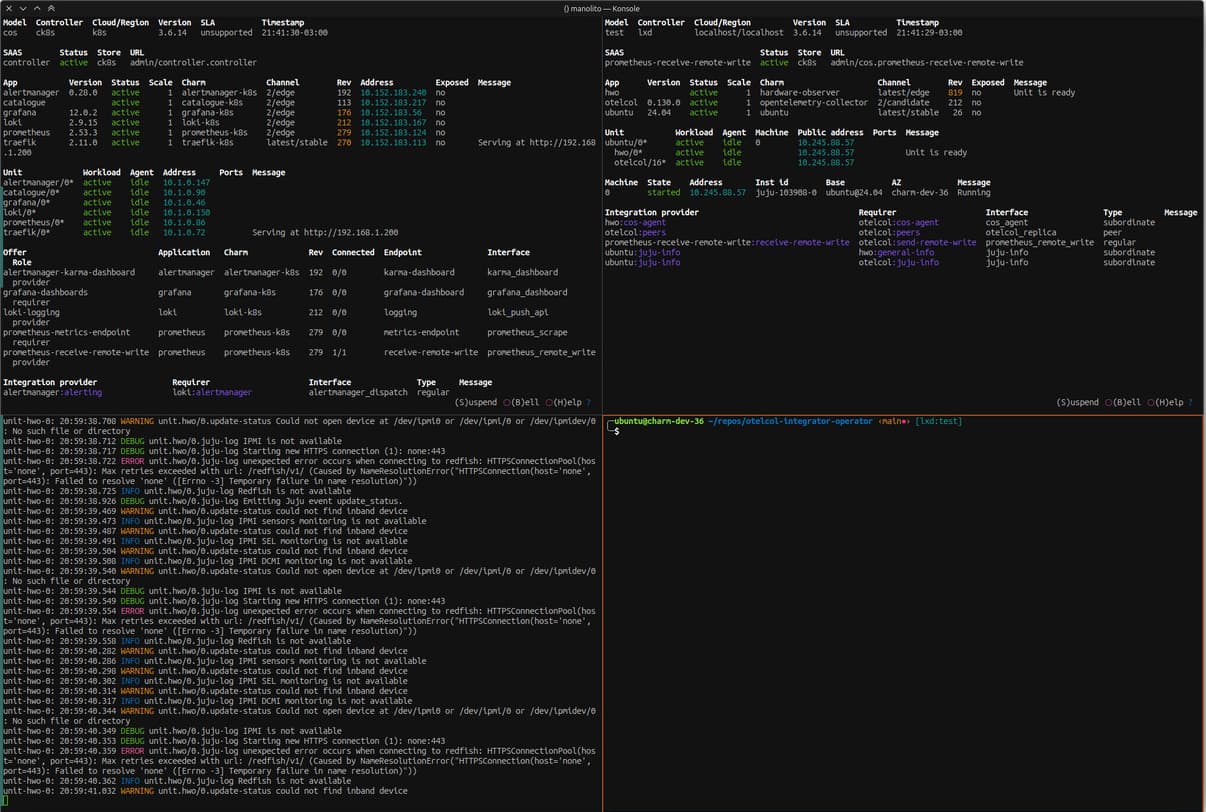
As I mentioned in the previous post, as a charm author, I spend my days at the console interacting with Juju, and I shared a screenshot like the one below, where out of 4 windows, 3 of them were for “watching” how the models I’m working on are progressing, either by checking their status or looking at the logs, and just a single window for running commands.
So I decided that JujuMate should be first and foremost a "read-only" TUI tool, and then, if the need arose, I would add "read-write" functionalities, that is features allowing users to create models, deploy applications, and so on. However, I must confess that, as things stand, I’m not entirely convinced by that approach. I believe that the opportunity to improve our ecosystem lies not so much in giving our users the ability to deploy an application from a TUI, but rather in allowing them to see at a glance how our models are evolving.
Anyway, we’ll see; perhaps the clamour from the community and continuing to use JujuMate every day will convince me otherwise ![]()
A quick glance is worth a thousand words
Without a doubt, juju status --relations --watch 2s is usually the command that runs for the longest time on my development VMs.
For any action I perform in Juju, I need to see “in real time” how the model evolves.
- “Did the integration I just created set up correctly?”
- “What is the internal IP of this unit?”
- “How many units does the application have?”
We might not realise it because it’s become second nature, but the above are just a handful of the dozens of questions that the command juju status --relations --watch 2s can answer at a glance when we’re operating a Juju controller.
What would happen if, taking this Juju command as a starting point, we took it to the next level?
Status: where it all begins
Once we’ve installed JujuMate using sudo snap install jujumate and run it, the first thing we see is the “status” of the model we’ve selected in our Juju configuration; in my case, it looks something like this:
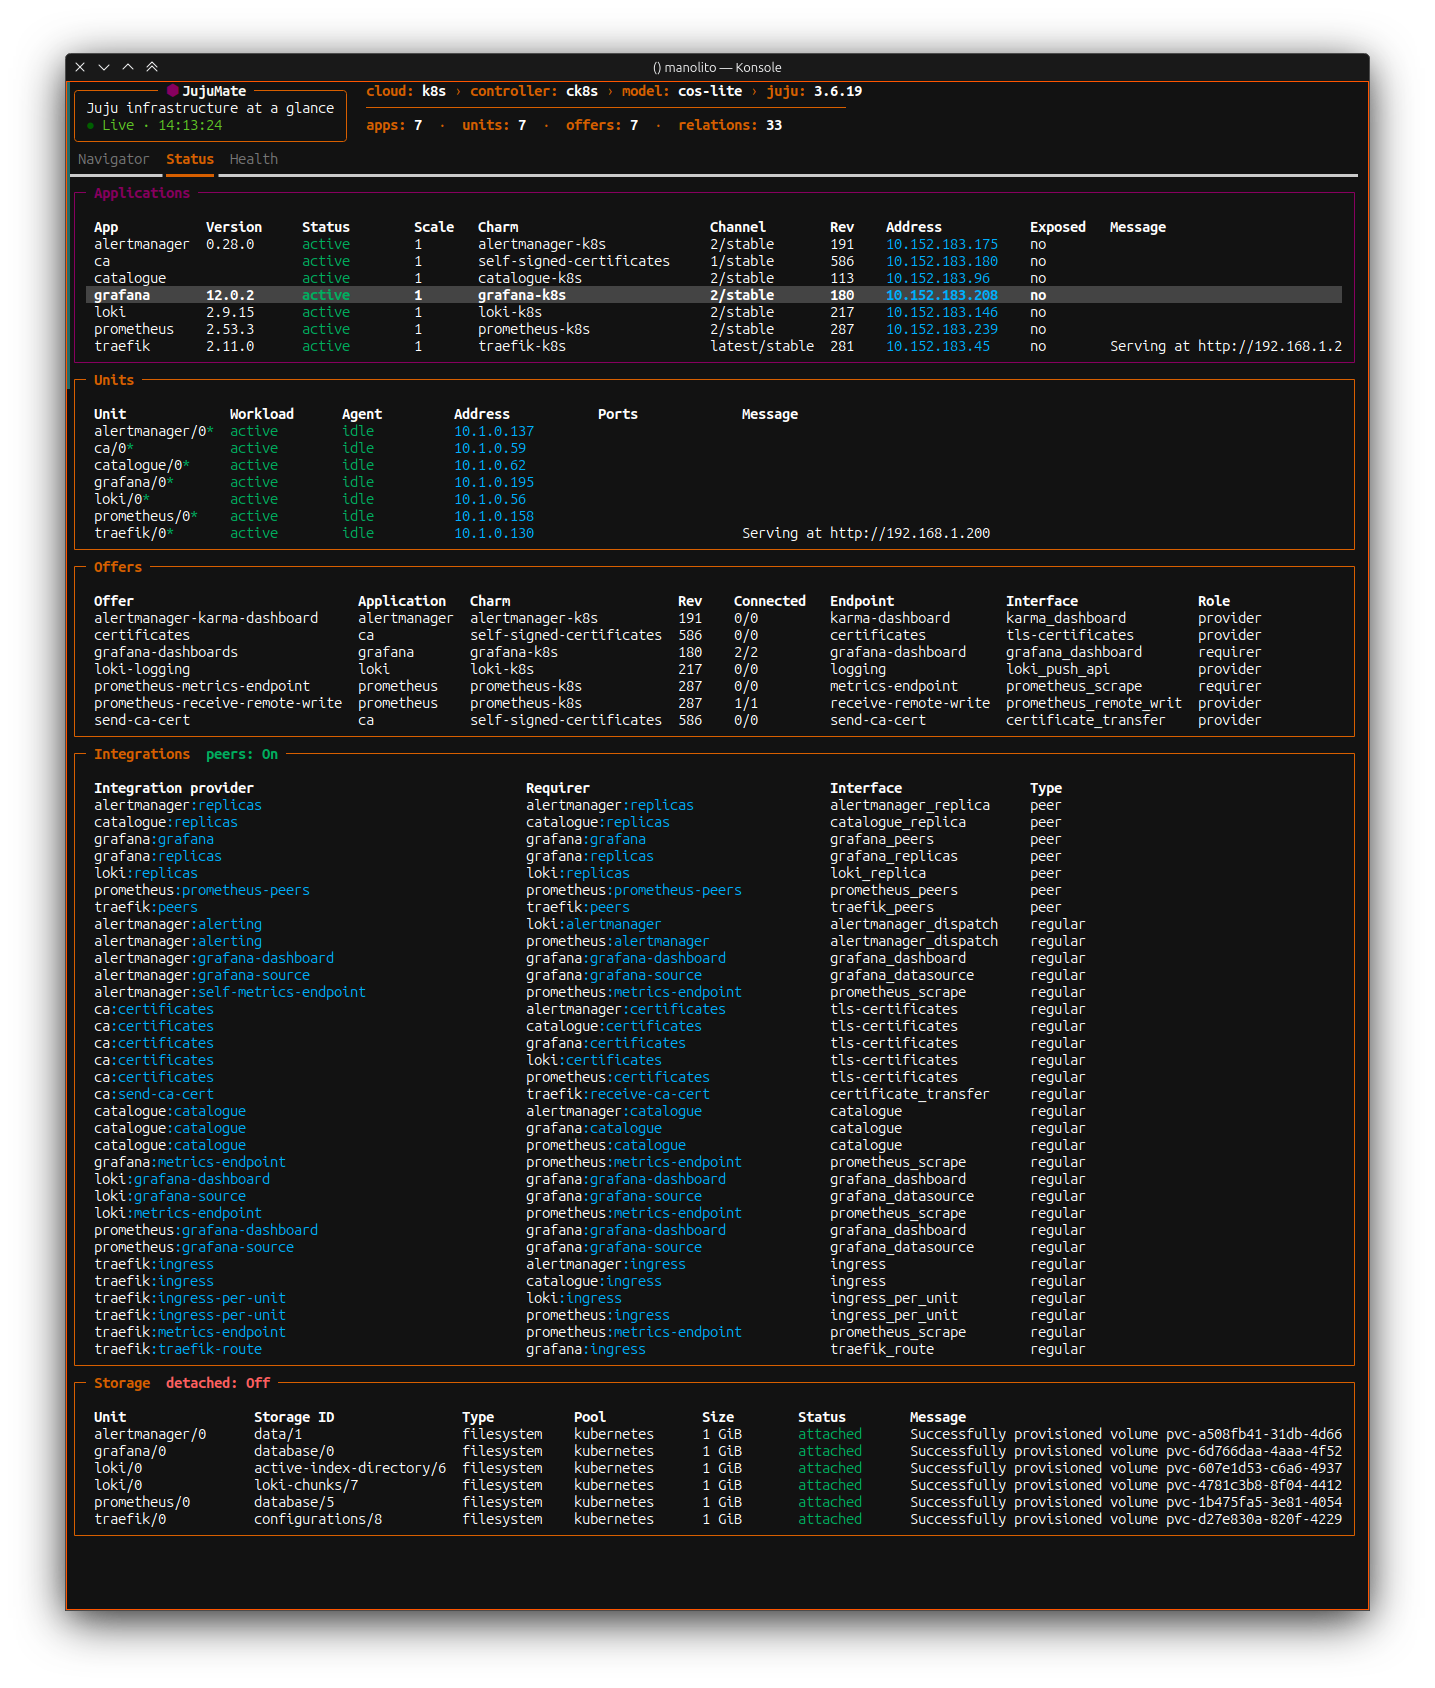
As you can see, the information displayed and the order in which it appears is similar to the output of juju status..., but let’s press the TAB key to navigate through the panels and see what other information is available.
The configuration of each application
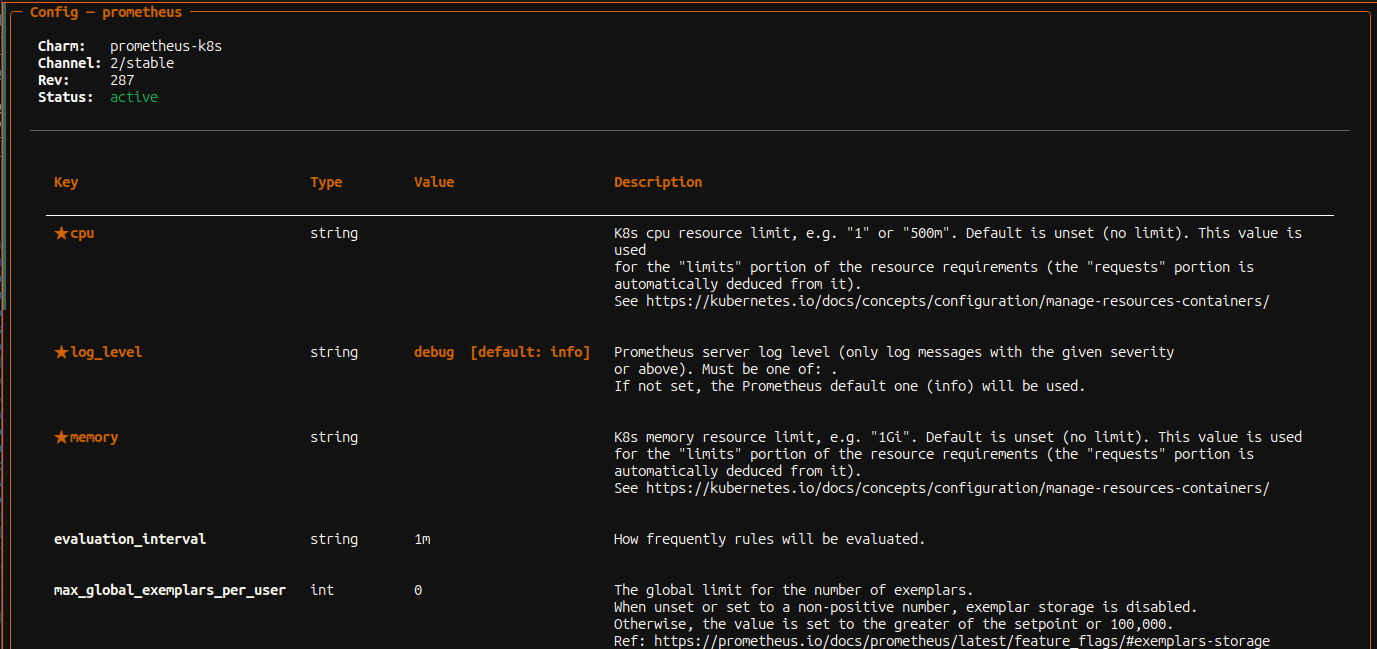
Whenever we want to see how an application is configured, we have to run something like juju config MYAPP and scroll through the yaml it returns.
Wouldn’t it be easier if we could just press ENTER on the application and let JujuMate show us the same information, but organised in a clearer way?
The answer is yes!
Offers!
Our model can expose endpoints (offers) so that other models can establish connections with it.
But is there a simple way to view the details of each one and see which other models are consuming them? Of course, just go to the Offers panel and press Enter on the offer!
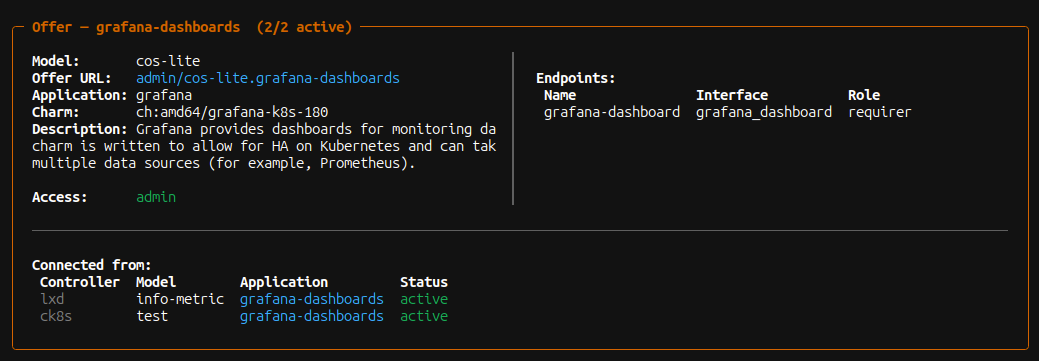
As we can see in the image above, in this case the grafana-dashboards offer is being consumed by two different models in two different controllers: ck8s:test and lxd:info-metric
The important thing is to keep our relationships healthy
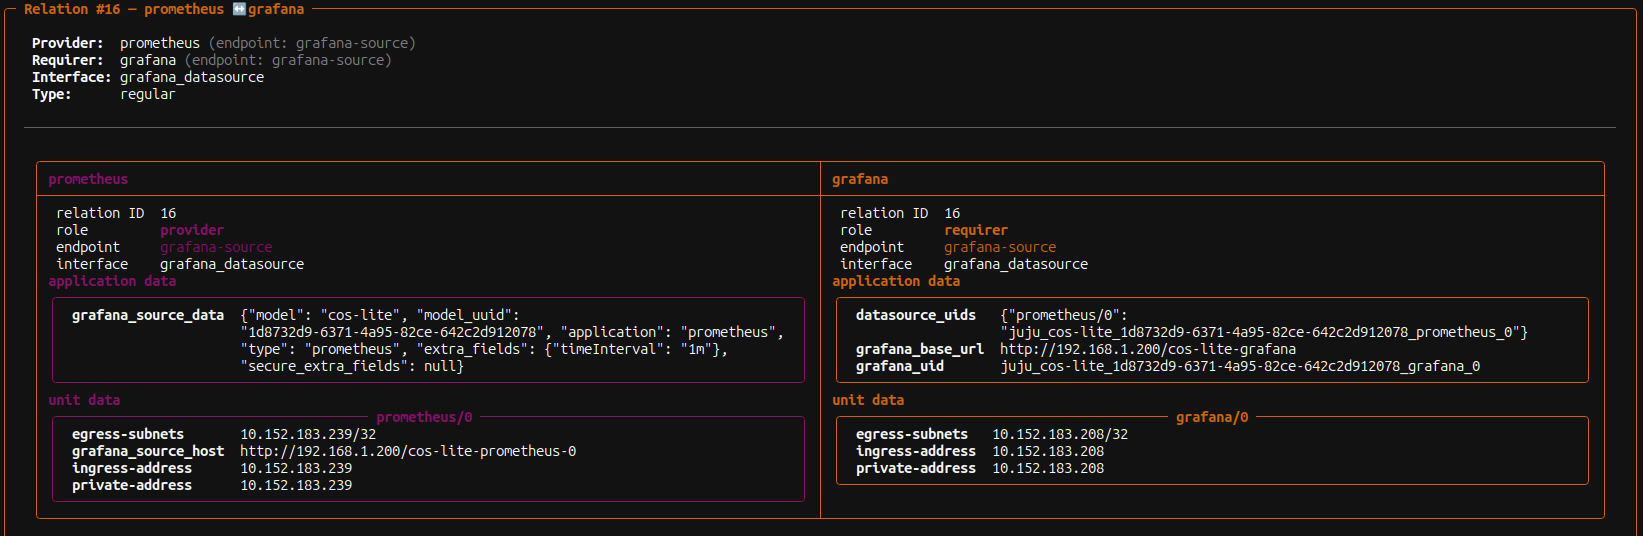
Accessing the information exchanged between two charms via a relations isn’t usually straightforward, so much so that our dear @ppasotti implemented a similar feature in jhack. But, if we’re already viewing the model’s status and have the relation we want to inspect right in front of us, wouldn’t it be more convenient if we simply pressed ENTER on it to see what information both charms are exchanging?
You need to know how to keep a secret
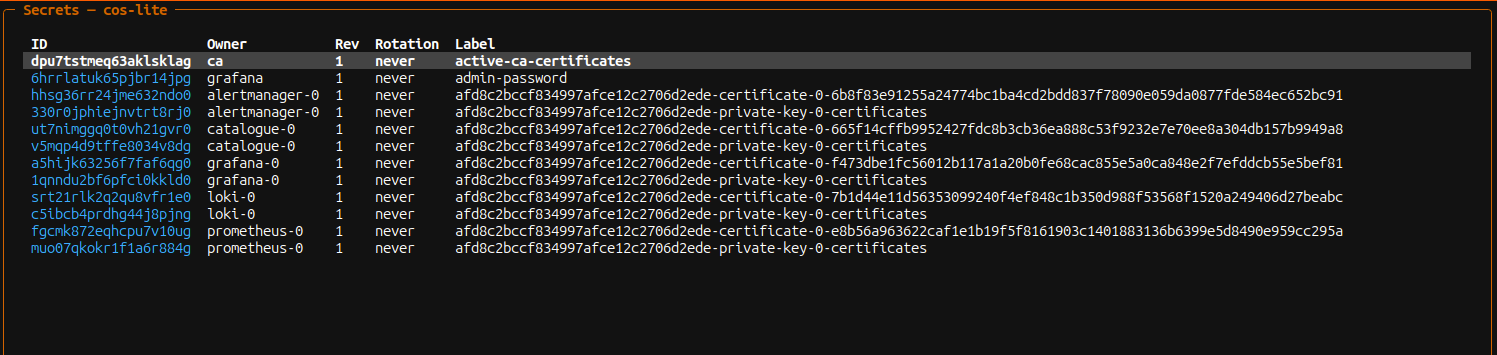
From Juju 3 onwards, we’ve started to have secrets, and interacting with them has become a regular part of our deployments. Wouldn’t it be handy to have a way of viewing all the secrets in our model? Of course! If we press SHIFT+s, a modal like the one below will appear:
I wonder if, by selecting a specific secret and pressing ENTER, I’ll be able to see the details?
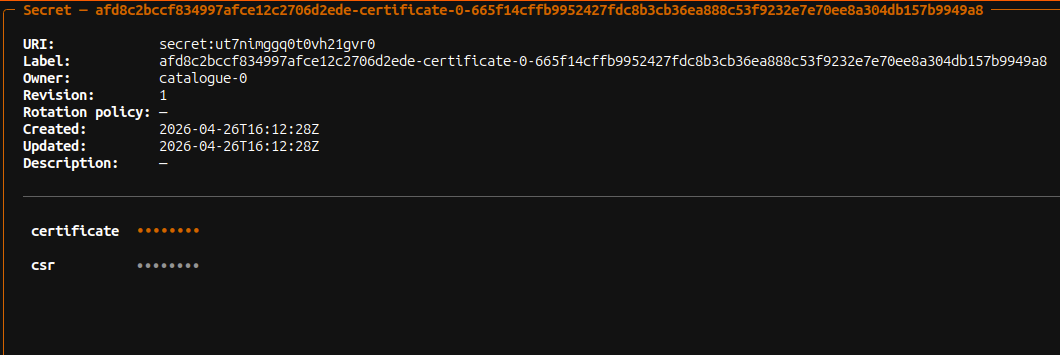
Sometimes I need to check that the certificate an app is using is the right one. I wonder if, when I use the arrow keys to highlight one of the keys and press the y key, the text will be copied to the clipboard? Of course!
Machines for the win
So far, my examples have been based on the status of a Kubernetes model. Is the status of a machine model very different? Well, not really, there’s just an extra panel: Machines
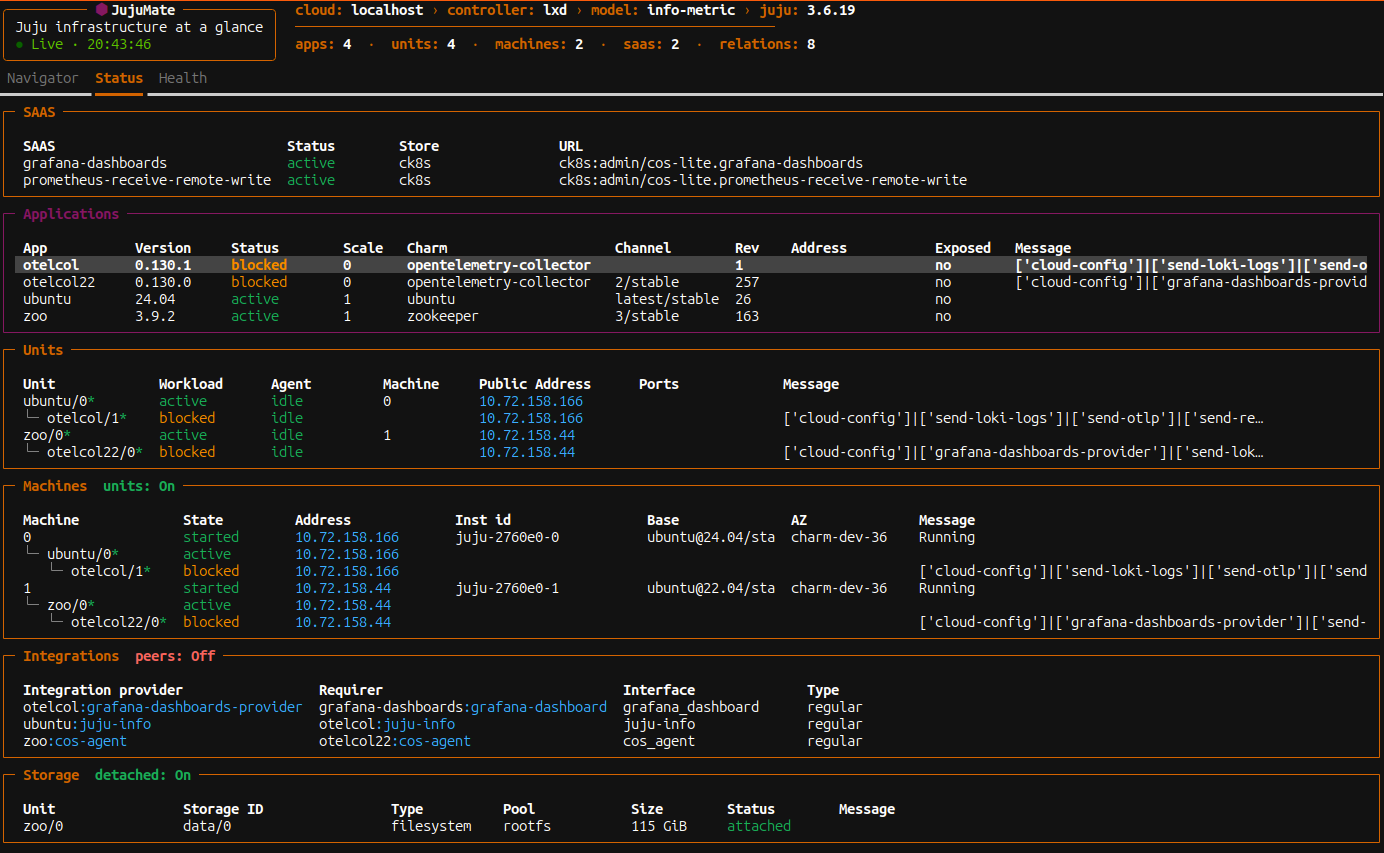
In the image above, we can see two extra panels:
Machines: This panel is only visible in machine models, but unlike withjuju status, here we can also easily see on which machine each application is deployed.SAAS: In this case, we see it simply because we are consuming offers from other models; it is not exclusive to machine models.
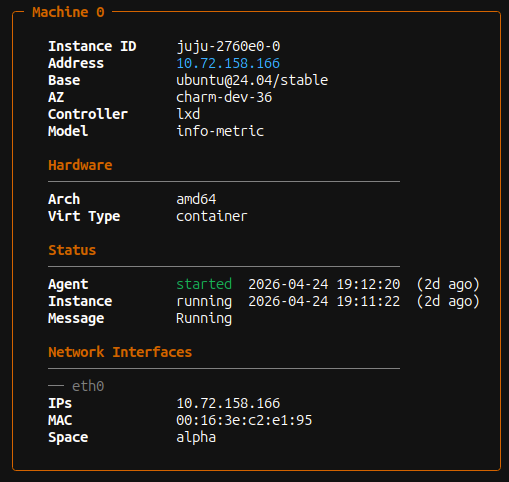
As with other panels, if you press ENTER on a selected machine, you will see its details:
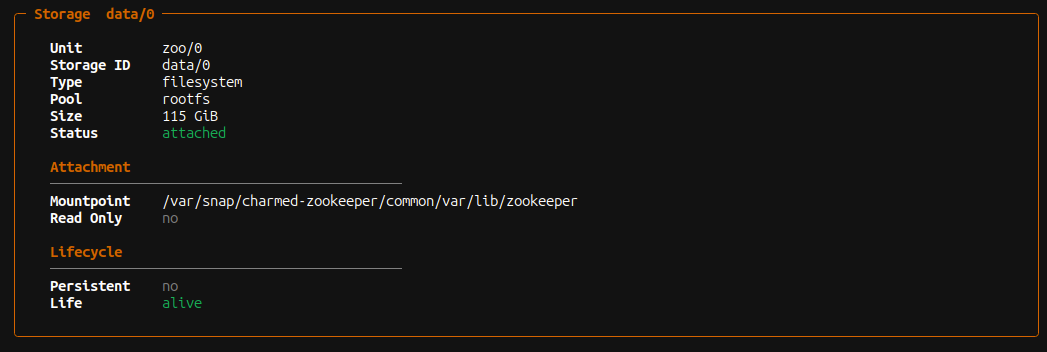
And the same thing happens if we press ENTER on one of the storage devices; we see its details:
Let’s keep a log of what we do
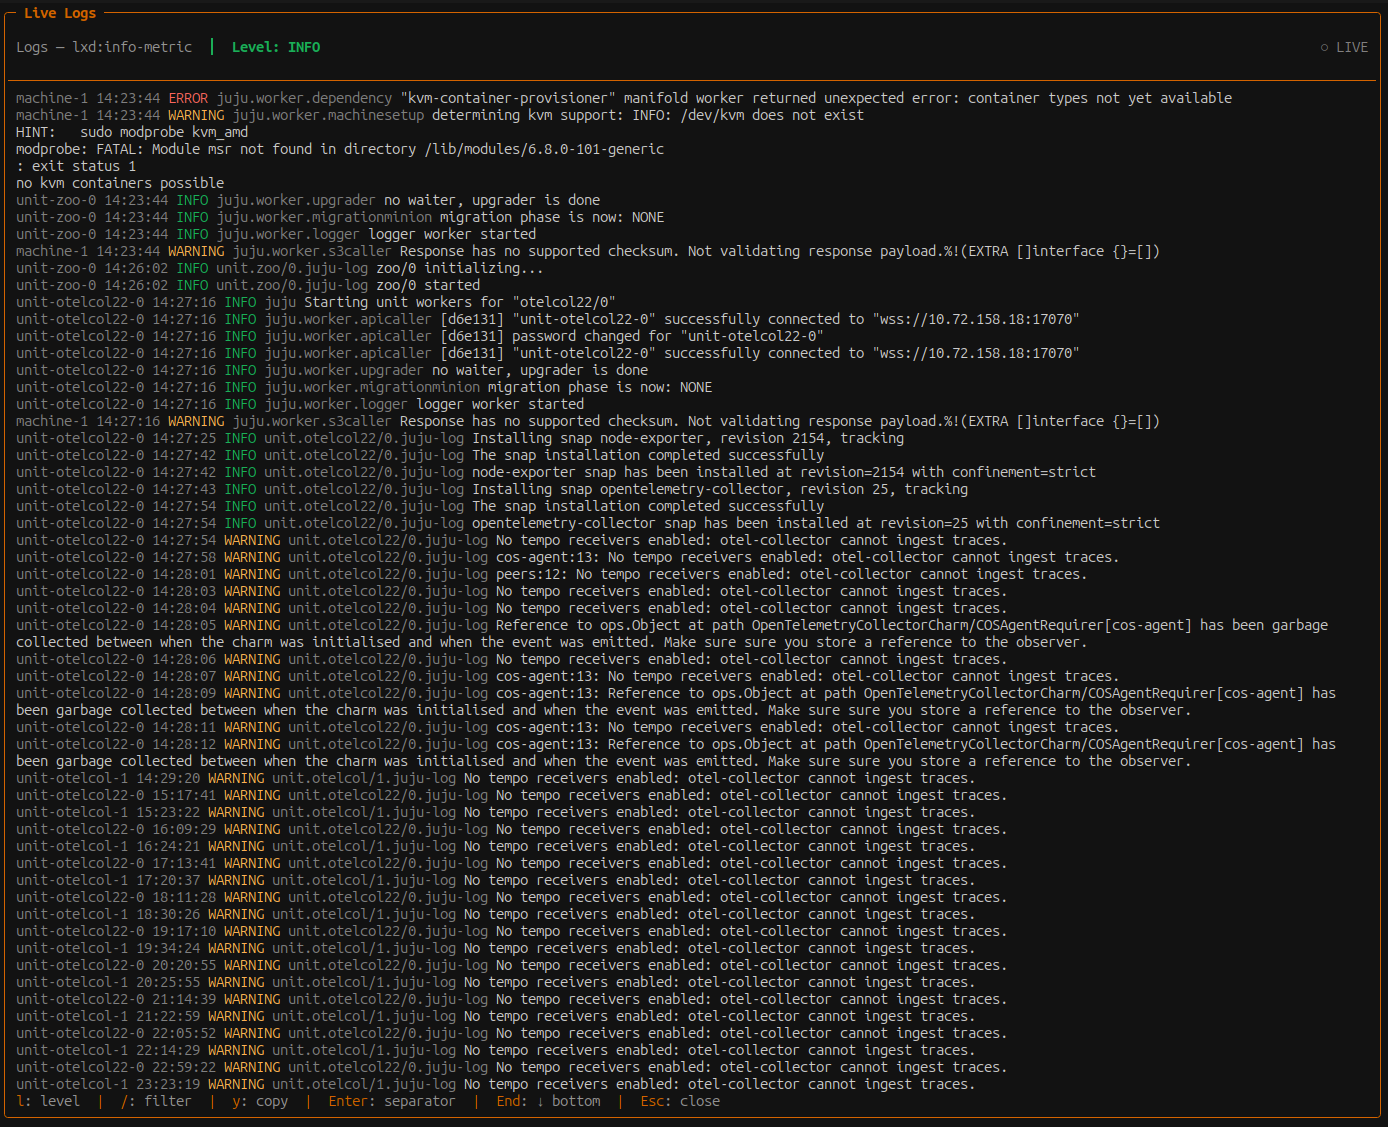
It would also be useful to be able to view the logs for the current model in real time, filter and copy them. Is that possible? Of course, a simple shortcut takes you to the next modal: SHIFT+L!
There’s more to it than just the Status tab
Let’s keep an eye on our models’ health
So far, we’ve seen that the Status tab lets us check the model’s status at a glance and access a wealth of information quickly.
But is there a way to see at a glance if there are any issues with any of the models running in our controllers?
Of course! The answer is the Health tab! Let’s press h to go there and we’ll see something like the following:
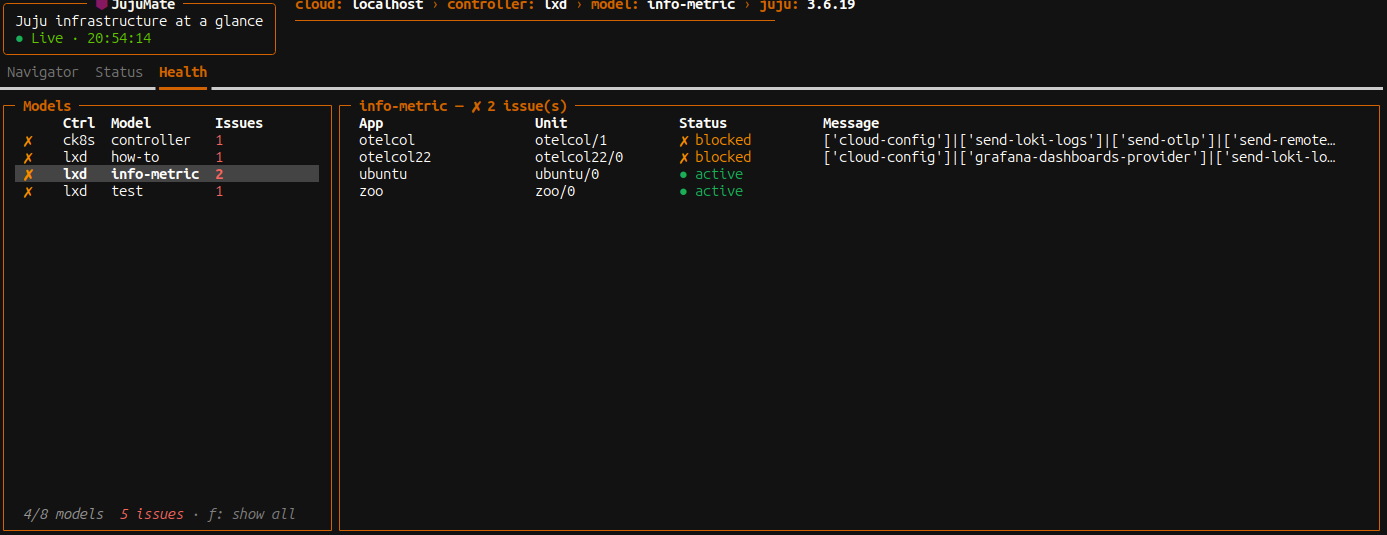
This tab contains two columns: on the left, we can see all the models that have an issue, and when we hover over one of them, the right-hand panel displays their units and their Status.
It is worth noting that this tab also allows us to switch between models… pressing ENTER on any of the models shown in the left-hand panel automatically takes us to that model’s Status tab.
Let’s not get lost: The Navigator tab
But JujuMate offers a much simpler way to navigate between clouds, controllers and models: the Navigator tab!
If you switch to this tab by pressing n, you can select the cloud, controller and model you want to view in a cascading menu to see their status.
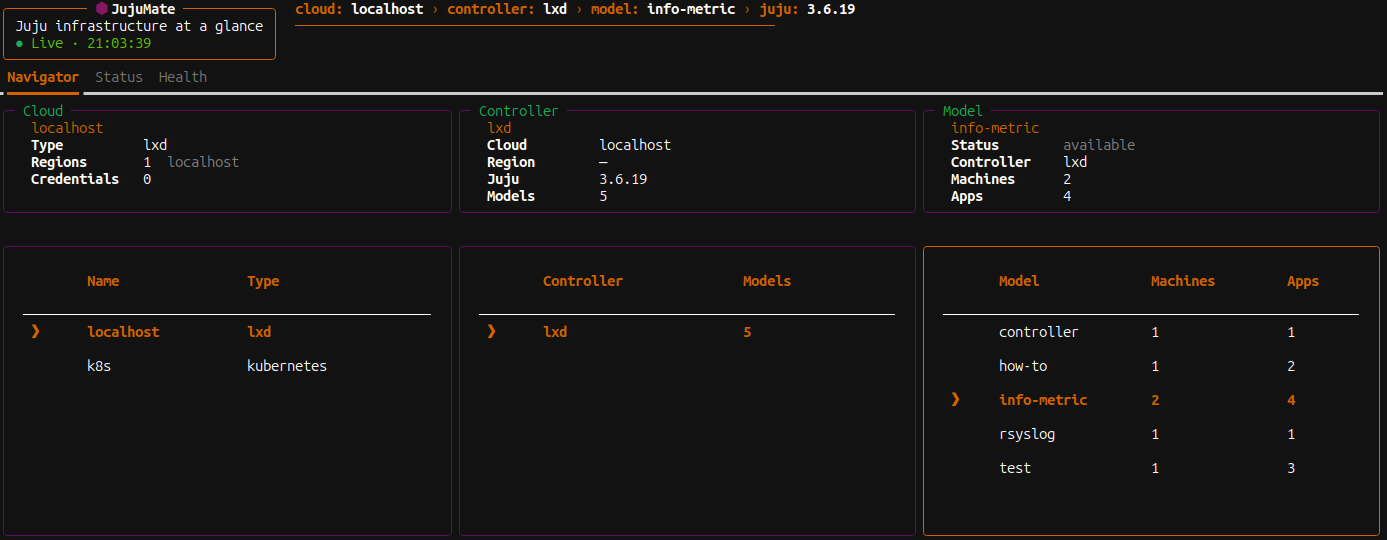
Once you have selected the model, press ENTER and JujuMate will take you directly to the Status tab.
The cherry on top
JujuMate has a number of settings that it reads from its configuration file; however, it is possible to change them directly from the TUI. Simply press SHIFT+c to access the settings panel:
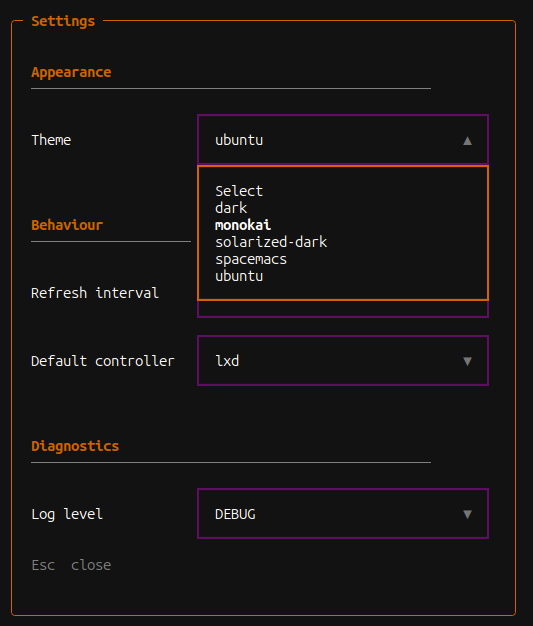
From here, you can change the theme, the refresh rate, the default controller and even JujuMate’s log level.
A few final words
I started JujuMate to see how far I could get using Opus 4.6, and so far it seems I’ve got further than I ever imagined, but above all, I’ve got there faster.
I began this post by paraphrasing Linus Torvalds, not because I think I can compare myself to him! Not even remotely!
But because this really is a project that’s a hobby for me. But it’s a hobby that makes my life easier when I’m writing charms. If there are features you think would be good to add, do let me know!