Raft API Leases - Part II

Juju contains a number of primitives that allow for building robust charm solutions. One of these is the concept of an application leader. The leader primitive allows units of an application to hold the leader status (akin to a distributed lock that expires) via an election process. The leader status gives authoritative status to a given charm allowing the charm to execute commands if they are the leader. You can read a more in-depth overview at the Leadership SDK.

The current leadership backend runs a Raft FSM instance, that is fronted by a publisher and subscriber event hub (juju/pubsub). In highly available (HA) setups, all communications are redirected from all the Juju controller nodes to the leader node. Pubsub nicely handles the complexity of this by forwarding all events to the leader via the raftforwarder worker. Applying any Raft logs to the FSM before sending the resulting event back.

In some scenarios pubsub can cause some quite problematic issues:

  1. If the Raft FSM fails to process the logs in a timely manner, the pubsub subscriber queue backs up and there isnā€™t a way to currently shed the load. The caller of the publish event times out the publishing of the event and returns an error, which can be subsequently retried.
  2. As we canā€™t shed the load in the subscriber queue, we compound the issue more by retrying, so more load is applied. A tsunami of events is visible.
  3. Even if weā€™ve timed out and performed the retry, we didnā€™t actually stop anything from processing the log and attempting to apply it to the Raft FSM. This can lead to weird state issues; where we tried to claim, we timed out waiting for a response, we try again for a claim, not knowing if we actually successfully made a claim.

Having said all of these issues, one thing to note is that the pubsub will continue processing claims as fast as the Raft FSM can process the logs. The Raft FSM will dictate the pressure it can handle if everything is humming along nicely.

The problem occurs if the load on pubsub is so high it causes some telltale signs:

  1. The controller flat-out dies and requires a restart (OOM death). There are so many resources required to keep the pubsub up that we just run out of memory. Restarting the controller allows us to shed the load, but if the other controllers havenā€™t also died, it creates a stampede of lease timeout errors.
  2. Starvation attempting to apply the global time to the Raft FSM. The Raft FSM has a global time that is advanced by the globalclockupdater worker, which ensures that an agreed time is coordinated between all nodes and the lack of an update causes problems downstream in the lease manager.

Having identified these problems, a design was settled upon to see if it was possible to reduce the number of restarts required and allow Juju to continue working, even under load. The proposed solution was to route the lease requests from pubsub through the API Server facades. This gave us two distinct benefits:

  1. We can use the tried and tested facade setup that has been battle-tested and is key to how Juju works.
  2. We can shed the load if attempting to apply a log to the Raft FSM takes too long.

This ended up being quite tricky to implement, as it required some machinery to get around the circular dependency engine problem (it required the API server to be up for us to accept the Raft logs, but Raft required the API server to be up at the same time).

Load testing

The last couple of days Iā€™ve been attempting to load test the new implementation and although weā€™ve had good success in preventing Juju from falling over, even under extreme load, I havenā€™t managed to find the sweet spot on getting it to process more load (more on this later).


To run these examples for yourself, you can follow along with the series of pull requests #13453 #13418. Additional information about lease scale testing.

The test was run using the localhost (LXD) provider, using HA 3 node setup. Using the leaseclaimer script from the previous lease scale testing.


Observations

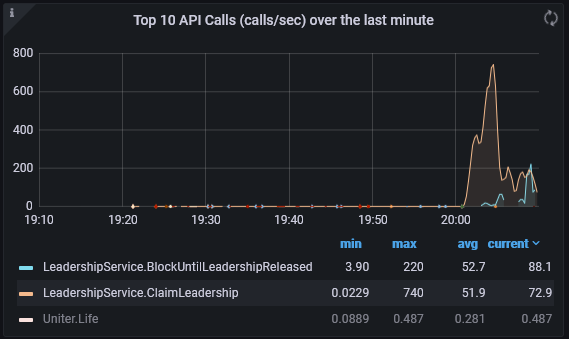
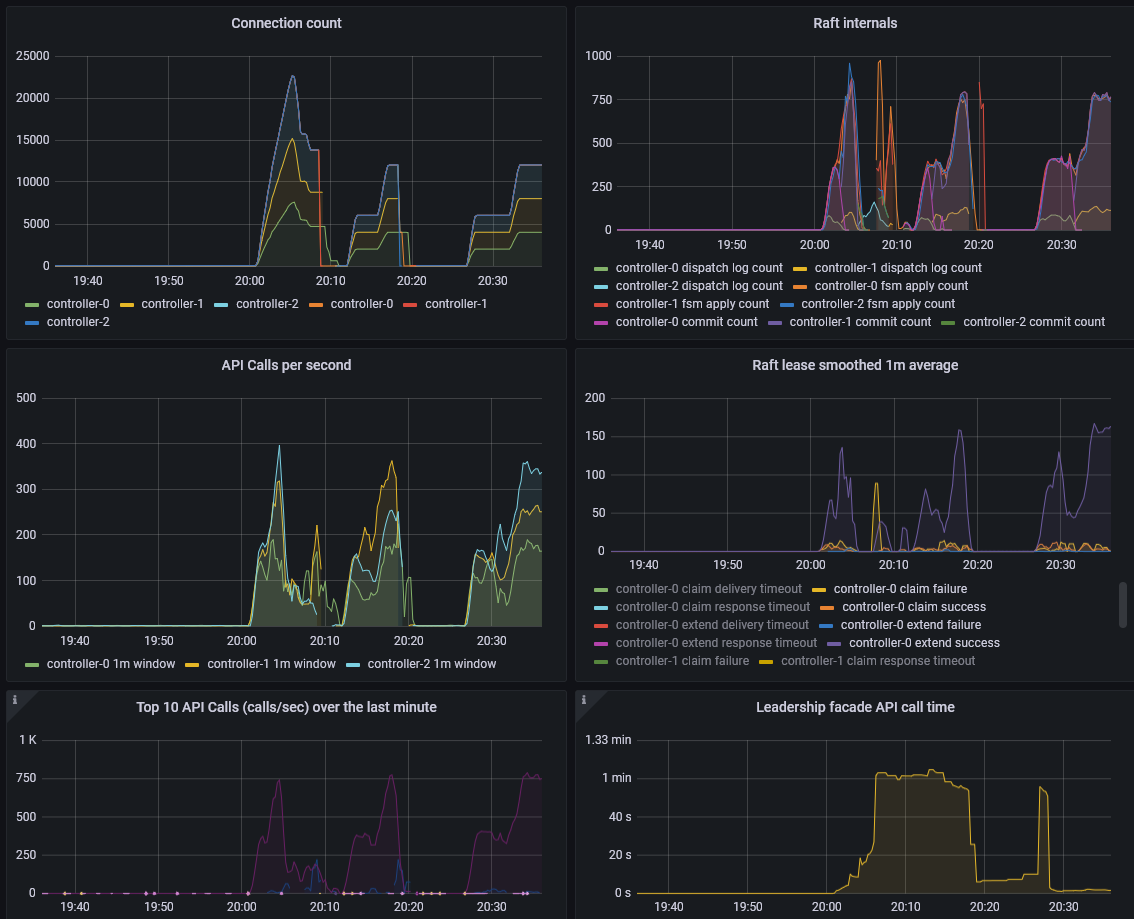
The dashboards are not exactly matching because the pubsub and API offer different metrics. Pubsub implementation offers the number of published and consumed events over a given time and the API showing the lease operations of consuming a raft log in milliseconds.

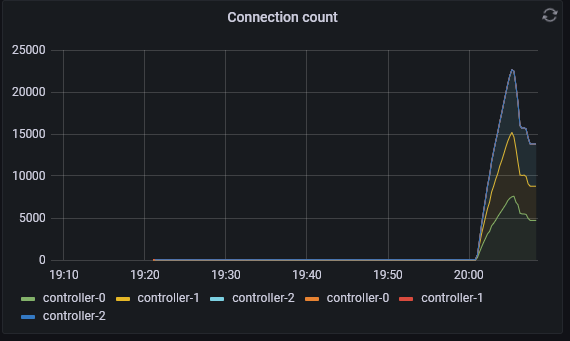
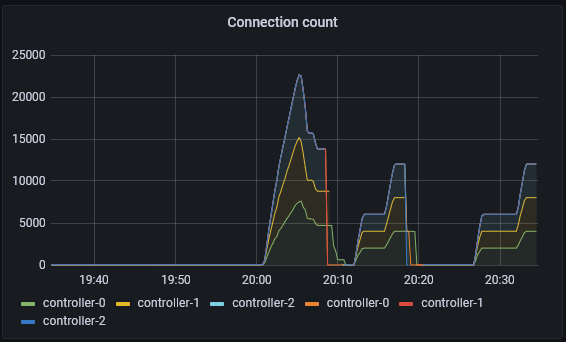
The following grafana dashboard shows pubsub easily handling 100 different processes, each with 40 leases, each with 3 units (roughly 3 * 100 * 40 = 12000 connections, vying for 4000 leases).

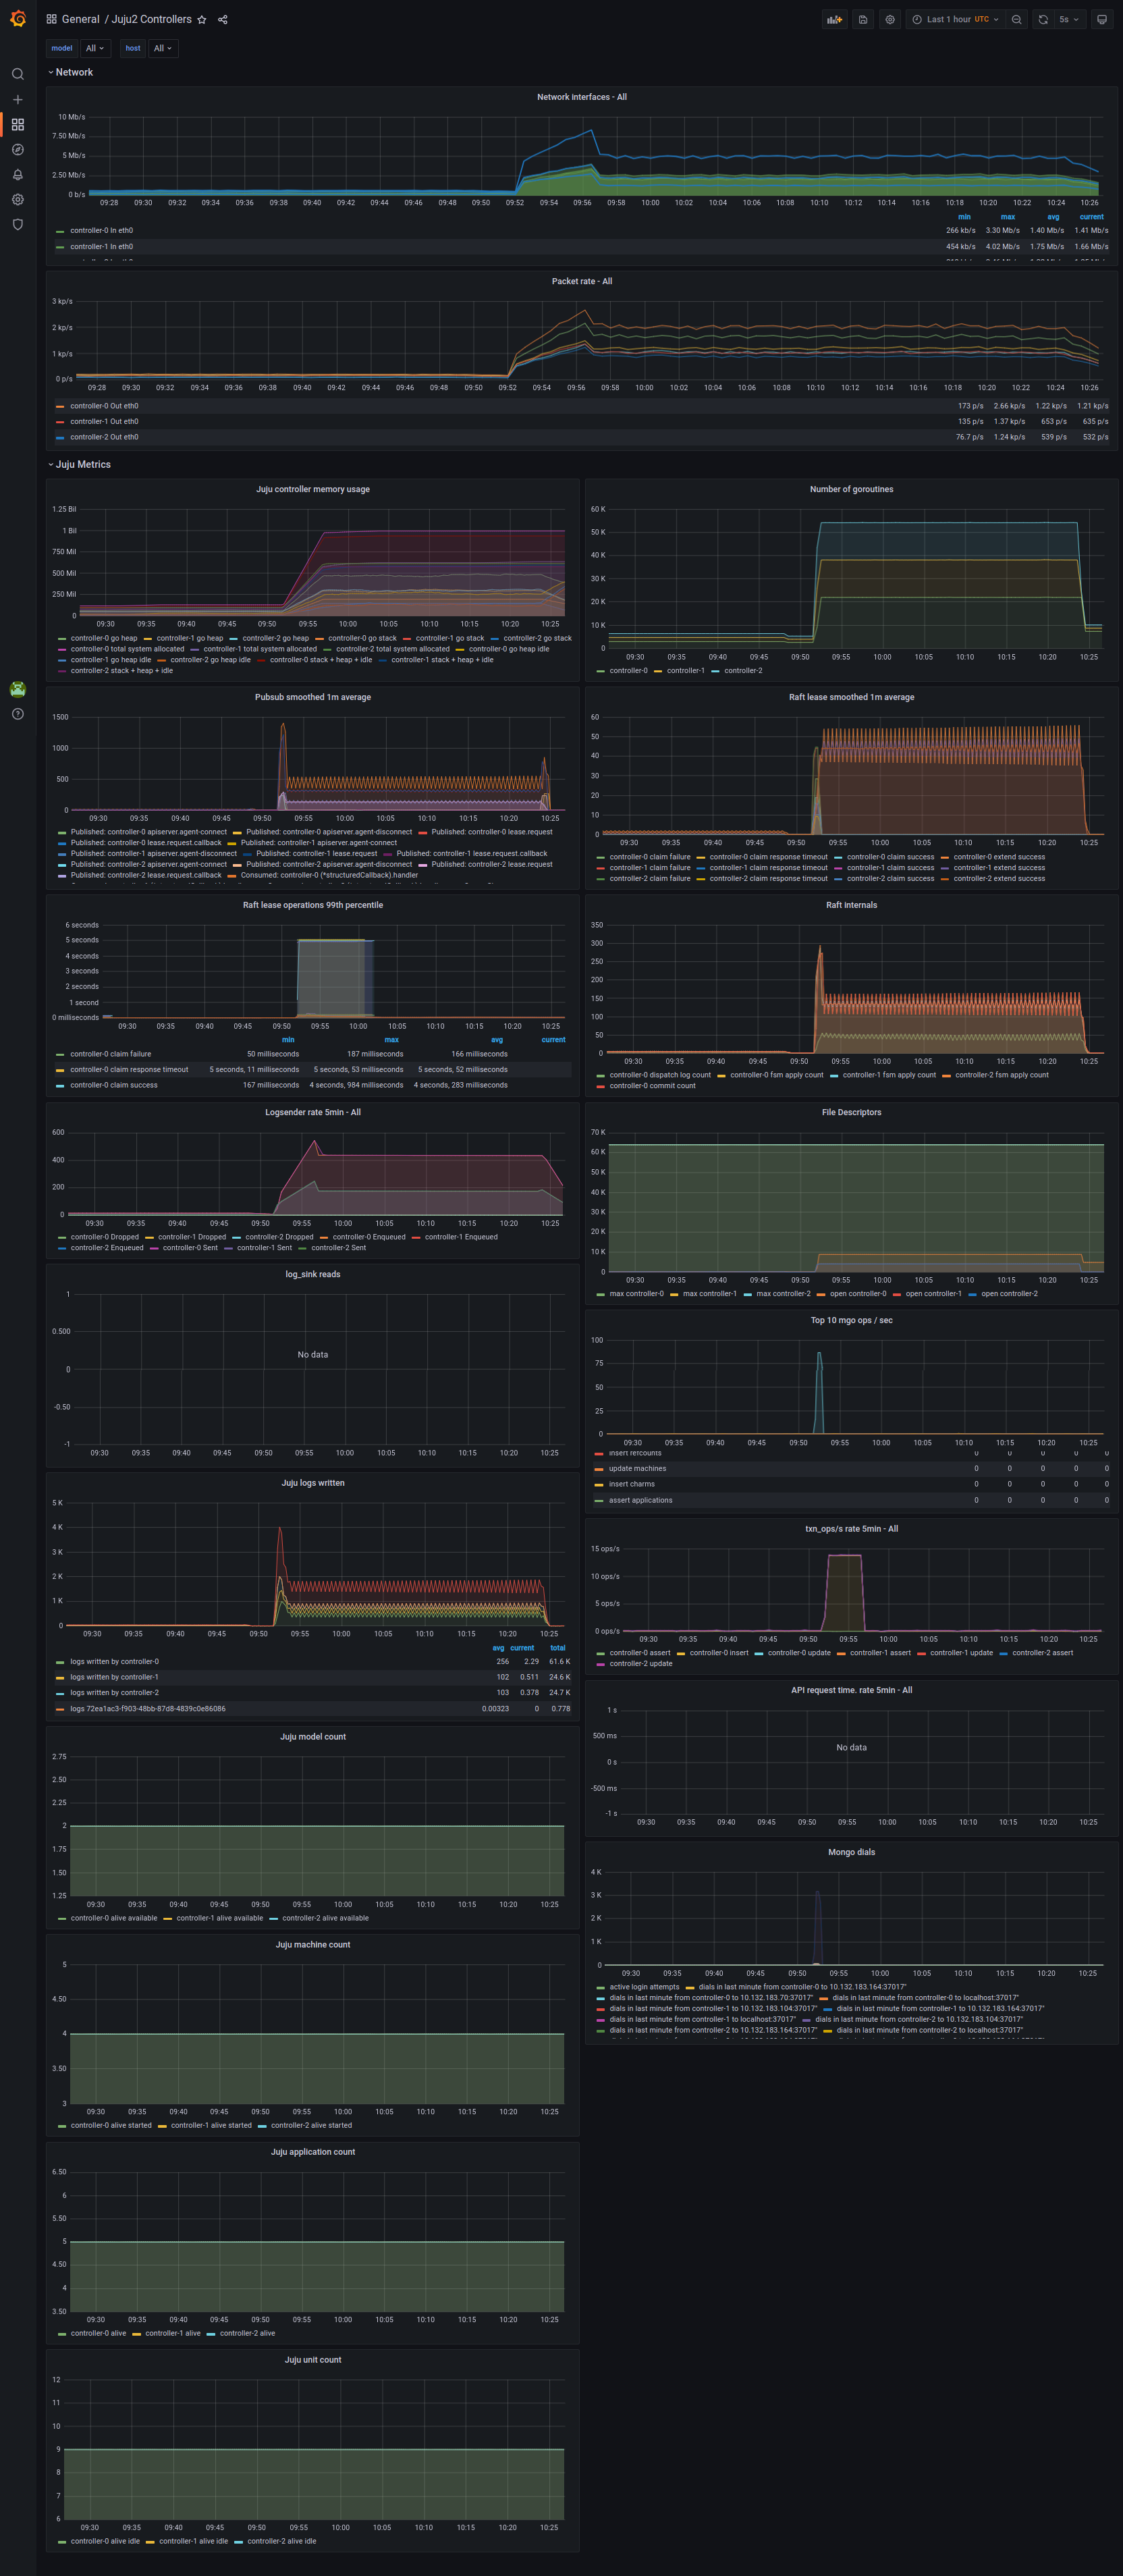
Pubsub is the first, API is the second.

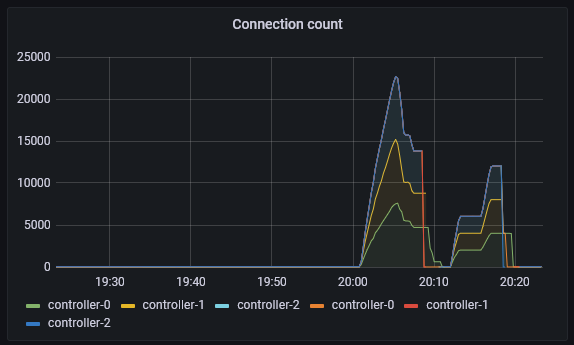
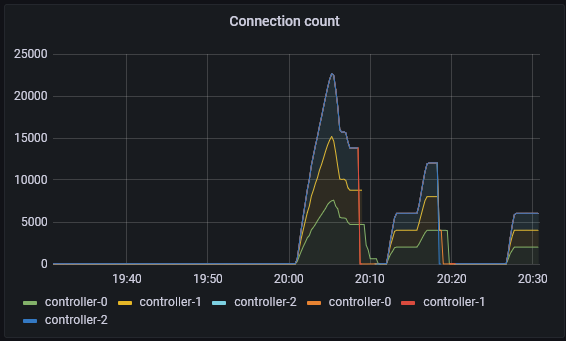
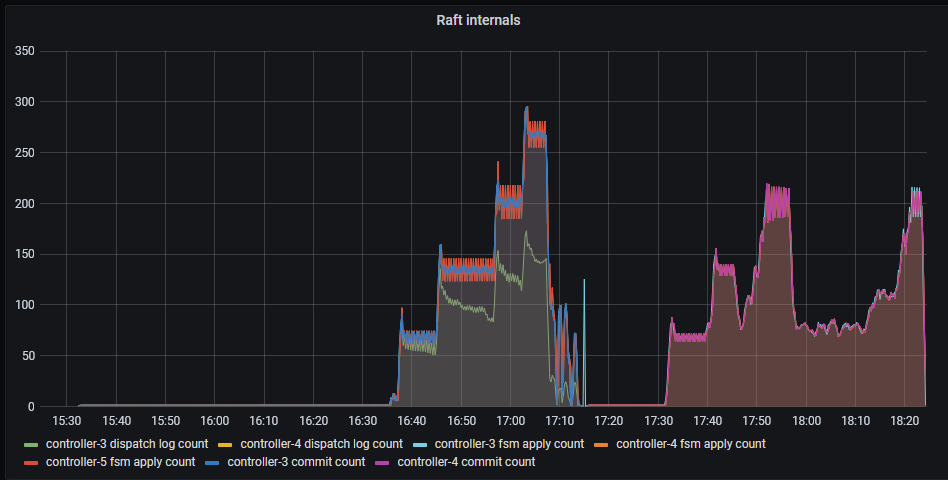
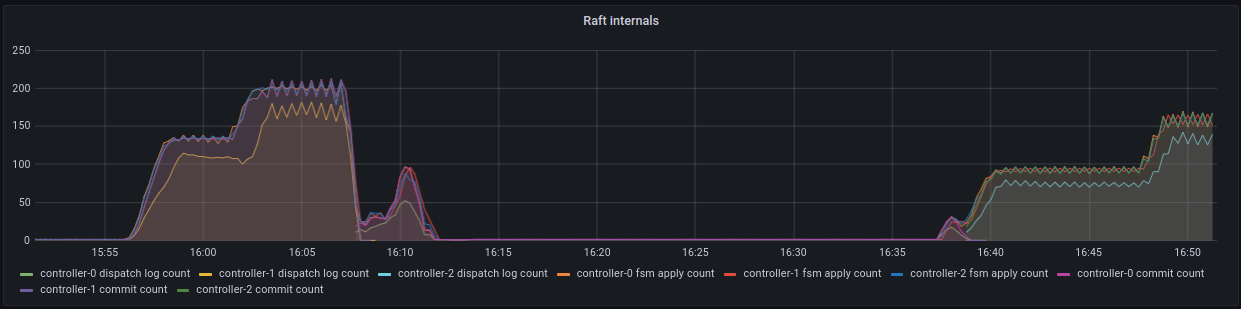
When we turn this up a few more levels; 300 different processes, each with 200 leases, each with 3 units (roughly 3 * 300 * 200 = 180000 connections, vying for 60000 leases). We can see that pubsub has started to see failures and the number of failures has started to rise. Although the number of apply count rate is very impressive at over 1000. At this point, the API implementation has started to shed the load and can not even get close to the pubsub implementation.

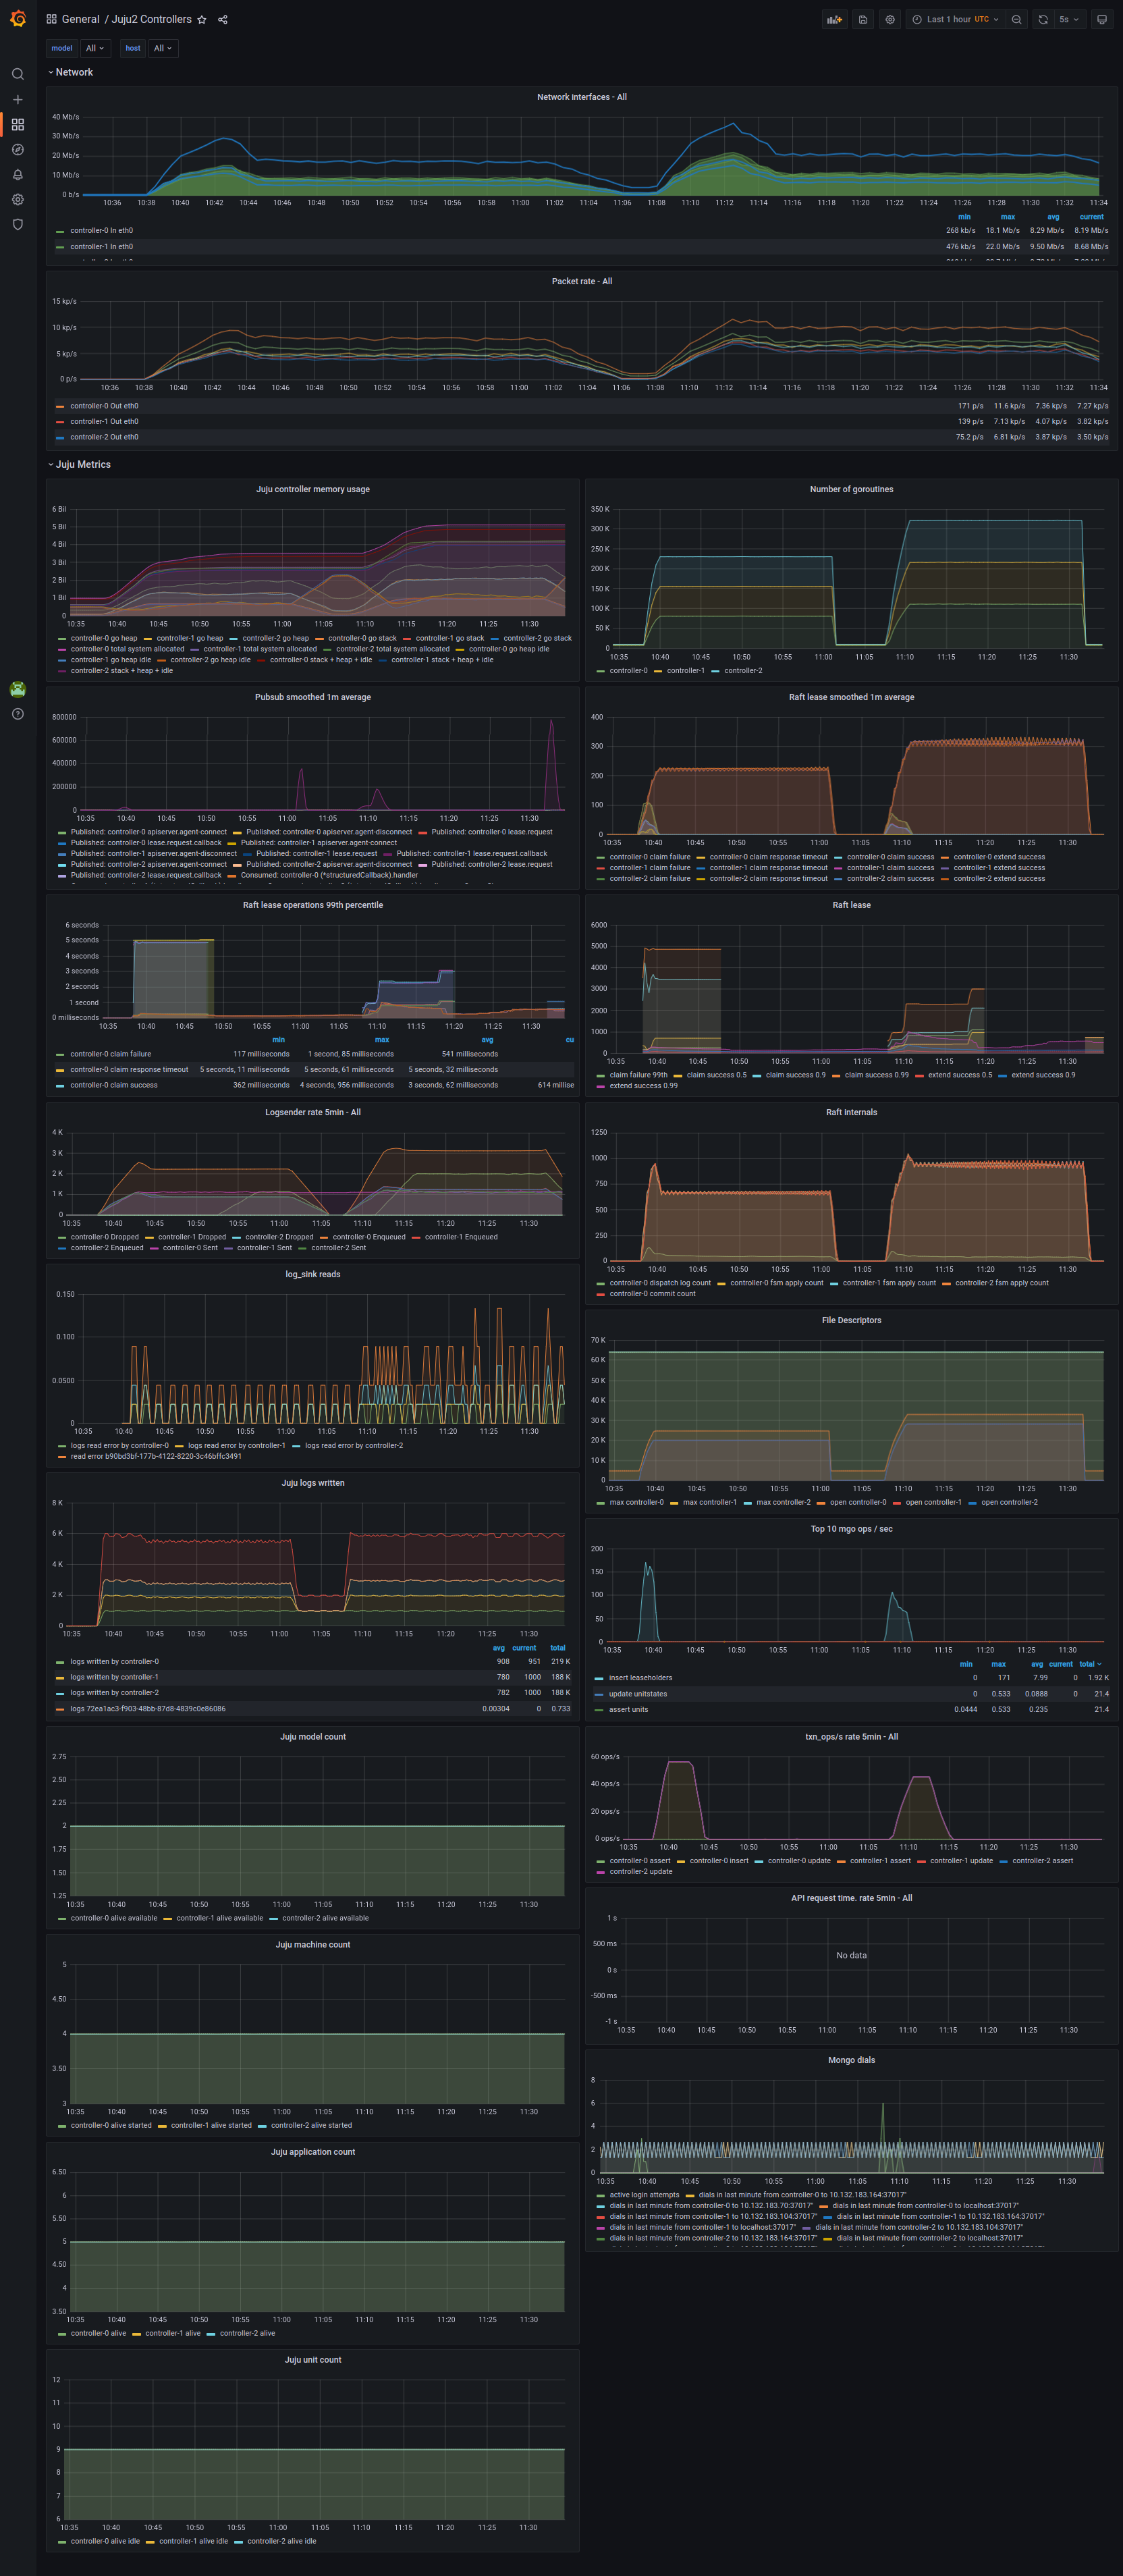
More work is required to push the API version through to a higher commit rate against the Raft log. The idea here is not to overload Juju till itā€™s crippled, but to correctly shed the load so that it never gets into a state where we have to restart it. Improving the API numbers should be possible, given that the pprof output from the API implementation shows that the raft log application isnā€™t in the hot path.

The future

There is ongoing work to relook at the way leadership is currently implemented and Iā€™ll post the spec here once Iā€™ve finalized it.

Thank you for going through all this work. It is very good to see direct analysis. It would be interesting to go through the dashboards with you and see if we can pull out some clear signals out of the data.

For example, it is interesting to see how in all cases (even at the 100x load) we are seeing client-side timeouts. It actually appears that if you donā€™t get a response in 1s, you just donā€™t get a response.

The second set of graphs where they are on the same screenshot are a bit harder to interpret. It is very nice to get them on the same axis, though. Do you have ideas on why the number of goroutines is so much higher, but still ā€˜steadyā€™? And memory consumption seems to correlate with that.

If Iā€™m reading it correctly, the Pubsub implementation only achieves about 210 successful claim-extends per second, while the API does have higher memory and goroutines, but gets to over 300 claims per second. Iā€™m also trying to understand why we see ~300 ā€˜controller-0 extend successā€™ messages, but nearly 1000 ā€˜controller-0 fsm apply countā€™. Is that because all 3 controllers are successfully extending leases, so we are applying significantly more?

You stated:

Either the graph is missing, or it is the second group of graphs and we are doing quite well.

Looking back at the first two screenshots, you have a dashboard in one for ā€œRaft lease operation 99th percentileā€, but the second one has ā€œRaft lease application 99th percentileā€. Is that just a typo and they are the same data? (They seems to have the same trend labels.) If it is, it is interesting that there are Timeouts in the PubSub case but none in API, and you have much faster failure response times. (API 99th percentile is hitting ~35ms for a failure, vs pubsub hitting 183ms failure and 5s timeouts) The slowest 99th percent for API was maybe 80ms, while the minimum for pubsub success was 167ms.

It would be good to understand if there is a missing screenshot here, because Iā€™m not seeing pubsub outperforming API, but it is plausible the failure modes are very different.

Also, if you are using the parameters supplied by run.sh note that these arenā€™t 'regular lease clients extending every 30s a lease held for 1 minute. They are trying to abuse the system and cut corners. So they only ask for leases that expire after 5s and only try to extend them after 4.5s. We give a lot more buffering for actual lease interactions. (The default if you donā€™t supply anything is a 10s lease extended every 5s, which is still way more aggressive than actual unit agents.)

My steps

  • Diff against juju 2.9 tip:
juju diff to disable leadership auth
diff --git a/apiserver/facades/agent/leadership/leadership.go b/apiserver/facades/agent/leadership/leadership.go
index f0d9328554..8c62ffc426 100644
--- a/apiserver/facades/agent/leadership/leadership.go
+++ b/apiserver/facades/agent/leadership/leadership.go
@@ -79,18 +79,18 @@ func (m *leadershipService) ClaimLeadership(args params.ClaimLeadershipBulkParam
                // In the future, situations may arise wherein units will make
                // leadership claims for other units. For now, units can only
                // claim leadership for themselves, for their own service.
-               authTag := m.authorizer.GetAuthTag()
-               canClaim := false
-               switch authTag.(type) {
-               case names.UnitTag:
-                       canClaim = m.authorizer.AuthOwner(unitTag) && m.authMember(applicationTag)
-               case names.ApplicationTag:
-                       canClaim = m.authorizer.AuthOwner(applicationTag)
-               }
-               if !canClaim {
-                       result.Error = apiservererrors.ServerError(apiservererrors.ErrPerm)
-                       continue
-               }
+               /// authTag := m.authorizer.GetAuthTag()
+               /// canClaim := false
+               /// switch authTag.(type) {
+               /// case names.UnitTag:
+               ///     canClaim = m.authorizer.AuthOwner(unitTag) && m.authMember(applicationTag)
+               /// case names.ApplicationTag:
+               ///     canClaim = m.authorizer.AuthOwner(applicationTag)
+               /// }
+               /// if !canClaim {
+               ///     result.Error = apiservererrors.ServerError(apiservererrors.ErrPerm)
+               ///     continue
+               /// }
                if err = m.claimer.ClaimLeadership(applicationTag.Id(), unitTag.Id(), duration); err != nil {
                        result.Error = apiservererrors.ServerError(err)
                }
@@ -101,18 +101,18 @@ func (m *leadershipService) ClaimLeadership(args params.ClaimLeadershipBulkParam

 // BlockUntilLeadershipReleased implements the LeadershipService interface.
 func (m *leadershipService) BlockUntilLeadershipReleased(ctx context.Context, applicationTag names.ApplicationTag) (params.ErrorResult, error) {
-       authTag := m.authorizer.GetAuthTag()
-       hasPerm := false
-       switch authTag.(type) {
-       case names.UnitTag:
-               hasPerm = m.authMember(applicationTag)
-       case names.ApplicationTag:
-               hasPerm = m.authorizer.AuthOwner(applicationTag)
-       }
+       /// authTag := m.authorizer.GetAuthTag()
+       /// hasPerm := false
+       /// switch authTag.(type) {
+       /// case names.UnitTag:
+       ///     hasPerm = m.authMember(applicationTag)
+       /// case names.ApplicationTag:
+       ///     hasPerm = m.authorizer.AuthOwner(applicationTag)
+       /// }
+
+       /// if !hasPerm {
+       ///     return params.ErrorResult{Error: apiservererrors.ServerError(apiservererrors.ErrPerm)}, nil
+       /// }

        if err := m.claimer.BlockUntilLeadershipReleased(applicationTag.Id(), ctx.Done()); err != nil {
                return params.ErrorResult{Error: apiservererrors.ServerError(err)}, nil
  • Bootstrap aws using a VPC and t3a.large instances.
$ juju bootstrap aws/us-east-1 jam-aws --config vpc-id=vpc-5aaf123f --bootstrap-constraints instance-type=t3a.large
Note about bootstrap being a bit slow

It is a bit surprising, but getting that initial bootstrap is slower than I expected. Cloud init starts at:

Cloud-init v. 21.3-1-g6803368d-0ubuntu1~20.04.4 running 'init-local' at Fri, 29 Oct 2021 18:44:34 +0000. Up 11.69 seconds.

The next interesting timestamp is during apt-install with:

Setting up tzdata (2021e-0ubuntu0.20.04) ...
Current default time zone: 'Etc/UTC'
Local time is now:      Fri Oct 29 18:48:28 UTC 2021.
Universal Time is now:  Fri Oct 29 18:48:28 UTC 2021.
Run 'dpkg-reconfigure tzdata' if you wish to change it.

I donā€™t know whether it took 3 min to run apt update && apt upgrade or if it just adjusted the clock, but it was slow to bootstrap (which is why I started looking). apt-get update seems like it was fast:

Fetched 20.4 MB in 4s (5075 kB/s)

Maybe it was the time spent generating the SSH keys?

Juju itself started shortly thereafter:

2021-10-29 18:48:58 INFO juju.cmd supercommand.go:56 running jujud [2.9.18.1 0 282a0bae4cfabd5ac5d3a638d643549812b7594f gc go1.16.9]

snap install itself was reasonably fast, about 15s:

2021-10-29 18:48:59 INFO juju.packaging.manager run.go:88 Running: snap install  --channel 4.0/stable juju-db
2021-10-29 18:49:14 INFO juju.replicaset replicaset.go:56 Initiating replicaset with config: {
  • Enable ha
$ juju enable-ha -n3
  • Switch to controller, create a prometheus user, deploy the bundle. Note that this differs from the Monitoring Juju Controllers because grafana moved to a proper name, and I wanted to deploy from charmhub. Iā€™d love to move to LMA 2 but it needs K8s running.
$ juju add-user prometheus
$ juju grant prometheus read controller
$ juju change-user-password prometheus
bundle.yaml
applications:
  controller:
    charm: cs:~jameinel/ubuntu-lite
    num_units: 3
    to:
    - "0"
    - "1"
    - "2"
  grafana:
    charm: grafana
    num_units: 1
    series: focal
    channel: stable
    to:
    - "1"
    expose: true
  prometheus:
    charm: prometheus2
    num_units: 1
    series: focal
    channel: stable
    to:
    - "0"
  telegraf:
    charm: telegraf
    series: focal
    channel: stable
    options:
      hostname: '{unit}'
      tags: juju_model=controller
machines:
  "0":
  "1":
  "2":
relations:
- - controller:juju-info
  - telegraf:juju-info
- - prometheus:grafana-source
  - grafana:grafana-source
- - telegraf:prometheus-client
  - prometheus:target
overlay.yaml
applications:
  prometheus:
    options:
      scrape-jobs: |
        - job_name: juju
          metrics_path: /introspection/metrics
          scheme: https
          static_configs:
              - targets:
                - '$IPADDRESS0:17070'
                labels:
                    juju_model: controller
                    host: controller-0
              - targets:
                - '$IPADDRESS1:17070'
                labels:
                    juju_model: controller
                    host: controller-1
              - targets:
                - '$IPADDRESS2:17070'
                labels:
                    juju_model: controller
                    host: controller-2
          basic_auth:
            username: user-prometheus
            password: $PROMETHEUS_PASSWORD
          tls_config:
            insecure_skip_verify: true
juju deploy ./bundle.yaml --overlay overlay.yaml --map-machines=existing
$ juju run-action grafana/leader get-login-info --wait

Upload the dashboard.json. Note that it needs a few tweaks because of metric changes:

  • juju_apiserver_connection_count became juju_apiserver_connections

  • juju_api_requests_total became juju_apiserver_request_duration_seconds_count

  • juju_api_request_duration_seconds became juju_apiserver_request_duration_seconds

  • Create another unit, upload leadershipclaimer to it (that way claimer load is separate from controller load)

# update the controller config so that you can add lots of logins
juju controller-config agent-ratelimit-rate=10ms
juju deploy cs:~jameinel/ubuntu-lite leadership-claimer
cd $GOPATH/src/github.com/juju/juju/scripts/leadershipclaimer
go build .
juju scp ./leadershipclaimer leadership-claimer/0:.
juju scp ./run.sh leadership-claimer/0:.
juju ssh leadership-claimer/0

And then inside the machine:

$ sudo grep apipassword /var/lib/juju/agents/unit-*/agent.conf
$ inject that into run.sh along with the controller API addresses and unit-leadership-claimer and `juju models --uuid`

Update run.sh to have 100 processes fighting over 100 leases.

When I try to run with normal pubsub, I end up getting a lot of:

  362.122s claim of "a1787" for "a1787/0" failed in 54.137s: lease operation timed out

That led to: image image

wipe it out, try again with fewer

killall leadershipclaimer

Drop it to 100 processes via for 20 leases (*3 units):

for i in `seq -f%02g 0 99`; do
    x="";
    for j in `seq -f%02g 0 19`; do
...
./run.sh

add another

    for j in `seq -f%02g 20 39`; do
./run.sh

(note that this is also with renewtime=4.9s, claimtime=5s)

That actually worked for a while, but then:

  413.937s blocking for leadership of "a0618" for "a0618/2" failed in 39.019s with error blocking on leadership release: lease manager stopped
...
killall leadershipclaimer

image

Then enable the feature:

$ juju controller-config "features=['raft-api-leases']"

Spin up the first 20: image

Interestingly, it is rock solid, and doesnā€™t have bounces or reconnects. Add another 20: image

After waiting a bit, it is still pretty rock solid, and the facade call time is very steady.

Double again by adding another 40

    for j in `seq -f%02g 40 79`; do
./run.sh

At this point, it does start thrashing and getting

  161.703s claim of "a8570" for "a8570/0" failed in 57.139s: lease operation timed out

However, I donā€™t see lease manager stopped. At this point, controller machine-2 has gotten unhappy:

2021-10-29 20:43:34 ERROR juju.worker.raft.raftforwarder logger.go:48 couldn't claim lease "1a18744b-20a6-4514-8afd-42602dc6b078:application-leadership#a8122#" for "a8122/2" in db: no reachable servers

And seems like it cannot recover. at the same time, mongo is unhappy:

2021-10-29 20:43:34 WARNING juju.mongo open.go:166 TLS handshake failed: read tcp 172.30.3.137:53478->172.30.0.18:37017: read: connection reset by peer

Iā€™m guessing one issue is that it is having back-pressure:

2021-10-29 20:41:14 WARNING juju.core.raftlease client.go:119 command Command(ver: 1, op: claim, ns: application-leadership, model: 1a1874, lease: a2745, holder: a2745/2): lease already held
2021-10-29 20:41:14 WARNING juju.core.raftlease client.go:119 command Command(ver: 1, op: claim, ns: application-leadership, model: 1a1874, lease: a4536, holder: a4536/2): lease already held
2021-10-29 20:41:14 ERROR juju.worker.raft.raftforwarder logger.go:48 couldn't claim lease "1a18744b-20a6-4514-8afd-42602dc6b078:application-leadership#a2913#" for "a2913/2" in db: Closed explicitly
2021-10-29 20:41:14 ERROR juju.worker.raft.raftforwarder logger.go:48 couldn't claim lease "1a18744b-20a6-4514-8afd-42602dc6b078:application-leadership#a9244#" for "a9244/0" in db: Closed explicitly

Which might be the patch that @simonrichardson has already proposed.

It does appear that there is work to be done, but it does look like it is going in the right direction.

So there have been a couple of updates that have happened recently to improve the situation. One of the fundamental concepts to the queue that controlled the rate at which raft was able to process the operations was to try and back off if there was little or no work to do. When there was work to do, we would process more items in a batch fashion to take more advantage of the fsync batching in the hashicorp/raft implementation.

One thing that was noticed very quickly, was that when doing a smaller amount of work compared to fully loading up the system (see above), there was always a penalty to encounter. That being the backoff delay. This happened to be 200ms. Changing the consuming algorithm to something more in line with peopleā€™s expectations has just landed on the tip of 2.9. This effectively gives us the best of the previous queue implementation and virtually no latency (5ms worst case) waiting to process an operation.

Additional work to remove excessive logging has also landed, so we no longer log the notify successes/failures (read as noise) to a separate log. Instead, we use the existing machine log and database (mongo) logging infrastructure.

The following shows an example of backing off at the queue level when adding too much load. The test was set up to see if backing off would successfully work without bringing down juju or mongo.

The test was broken into stages, the first one was to check that the setup was in order and then the rest are the real test. Each is claiming for 10 seconds and renewtime of 5 seconds.

for j in `seq -f%02g 0 1`; do
...
for j in `seq -f%02g 1 39`; do
...
for j in `seq -f%02g 40 79`; do
...
for j in `seq -f%02g 80 120`; do
...

As you can see from the graph, each block was run after 5 minutes and then another one is added. As you can see at A, the third one is too much to process and starts shedding load. At B we return to a rate that can cope with, whilst everything is still churning.

There are some issues that still need to be looked into, but Iā€™ll leave those as bugs for now.

  1. If the singular worker gets stuck in the queue with all the other lease extensions, it causes a lot of workers to bounce. Mongo is still working (independent metrics of mongo during the test ), itā€™s the fact that the singular worker hasnā€™t registered in to say that itā€™s still alive causing it to move to another controller. The shorter-term fix is to probably prioritize the singular worker to have priority to ensure that it can extend the lease, either by jumping the queue or having its own queue. LP1950640
  2. Exessive logging can slow down the test, maybe we should run a test without logging to see how things are progressing. The results could be a lot better.

The reason we blow out to 30-45 seconds, is because of the retries within the manager. If we get evicted from the queue after 3 seconds, and we retry 10 times. Then take into account network traffic and pre and post queuing times for every request, you can see why we top out at that number.

The solution is to just not retry for claims, another claimer can come around later and take that (we donā€™t care whom) and for an extending claim, we retry 3 times. This should at least prevent churn if it does work the next couple of times. Considering extending is a lot cheaper than claiming, I think this solution is the way forward.

The PR to fix this can be found:

https://github.com/juju/juju/pull/13501

Thank you for the very clear write-up of issues and approaches.

For my understanding, is the raft mechanism here separate to any database-level consensus algorithm? This is a purpose-specific raft transaction just for leader election?

Thanks for the link. :+1:

Correct. This was implemented a few years ago (prior to dqlite being an option). I think as we are doing the database changes we will want to look at this again as something to bring back into the same database. (It was operationally a big win for Prodstack, and it was a potential experiment if we could use something other than mongo, but ultimately it is overhead of something we need to maintain and understand that is different from everything else.)

Simon and I investigated this a bit deeper last week. We also discovered a very interesting ā€˜pastebin for grafanaā€™ graphs that is quite handy. (Iā€™m sure it potentially leaks sensitive information like IP addresses, but for pasting a debug session on a throwaway controller it is quite nice.)

This lets you browse the graphs yourself, as though it was the live Grafana instance.

https://snapshot.raintank.io/dashboard/snapshot/pZBsZ9ofjUkXKoqbJOqSypG0UafDFZGV?orgId=2

To give context, the graph encompasses testing against a Juju 2.9.18 controller with 3 C6i.xlarge instances. If we do a future round of testing, Iā€™d want to use smaller instances because it was too hard to actually get the system into failure.

There are clearly 2 periods with high activity, and the first is running a load test against 2.9.18 running pubsub and the second is with doing API requests.

One thing that we observed with the new system is that it definitely starts giving back pressure once it sees its queues starting to fill. (As a reference point, Prodstack 4.5 sees around 80 requests to extend leases per second, but it is also on a system that is loaded with other queries, etc.)

The new system shows signs of stress once you go above 200 requests, and starts rejecting requests:

However, it rejects Extending a lease as likely as Claiming a new lease, and this has the negative side effect of yet again increasing load on the system. (Any lease that doesnā€™t get extended will cause a change in leadership, increasing load.)

So we talked through having the system start shedding load by rejecting new Claims before it starts rejecting Extensions. Which Simon has a patch for now.

The other very good behavior from the system is that when load went back down, it did fully recover without any of the internal systems bouncing. I do think we need to tweak when we start applying backpressure, but we at least can do so properly now.

Are we running a separate Raft transaction for each extension or claim in the system? In other words, if I have 200 models with 3000 applications in them, am I running a separate Raft transaction any time any application has a new claim or extension?

There is an entry in the raft log for every extension and claim. And yes, if you had 200 models each with 3000 applications, there would be 200*3000=600,000 leases. However, there is only 1 lease per application, not 1 lease per unit. And you rarely have thousands of applications. (PS4.5 has a total of 1,238 machines, with 2,184 applications and 6,875 units, across 362 models.) So that is 2,184 leases that are active (and refreshing at 30s means ~73 extensions/s).

Weā€™ve also talked about just using the existing socket heartbeats from active connections to the controller, potentially avoiding any recurring log/update to say that you are still alive. We are working through how to coordinate between the controllers. If unit/0 is connected to controller/0, and unit/1 is connected to controller/1, one of them can be made leader, but the other should take over if the first goes away, which we currently coordinate via the extension entries in the raft log.

1 Like

Just to get this down on record, Iā€™m curious about batching. It seems to me that any claim or extension can handle a 0.1s delay, which means we could do these in ten batchsa second without any noticeable performance issue from the unit perspective. batching up all the claims/extensions in a single transaction ten times a second seems a nice way to scale than running individual Raft transactions for each application across all models. In the PS4.5 case that would be 7/8 applications per transaction, ten times a second, in my example it would be 10 applications in a transaction, ten times a second.

1 Like

Iā€™ve spent some more time today load testing raft leases with the new changes that are either landed on 2.9 (13506) or going to be landed soon (13501, 13497, 13481).

You can see the export dashboard.


The first test was with pubsub, I started quite aggressively here and went straight for 0..39 and then went up in 20 increments (3 altogether). At A, pubsub started falling over quite hard and just started to stop processing claims and failures came quick and fast. Status actually stopped working here, I think everything bounced.

I then turned on raft-api-leases feature flag (restarted the controllers) and applied the same test and the test showed that we could easily keep up with pubsub for the first two rounds. The issue we had with the raft leases is that weā€™re now losing the ability to tell the clients to back off as efficiently. We do see deadline exceeding errors, but weā€™re not doing it fast enough and we instead stop processing claims at the leadership claimer level. We do have the ability to recover quite fast, but itā€™s not in the same vein as the previous implementations.

You can see the export dashboard


The above graph shows the running of the load testing after the first load test, without restarting. Notice we're not getting fully the same throughput, as we're getting these error messages in the leadership claimer.
46 failed to connect to &{[54.85.192.43:17070]    model-6a8c834c-f98f-4c30-841e-d143e4518be7 false unit-ubuntu-0 wU1CpRqQuZmev0c4IAF0rNh3 []  <nil>} for a1755/1 (retrying): try again (try again)

Observations

  1. Going faster, by adding everything in a gorountine is allowing us to scale, but weā€™re losing the ability to shed load efficiently.

  2. Maybe we need to look into batching, the API is designed for it, itā€™s a matter of plumbing it all together.