I set up some scale testing of the new Juju Raft-based Leadership settings, using Juju 2.5.0 vs 2.5.1-proposed each with one small patch. Many thanks to Christian and Joe for helping with all the Lease changes.
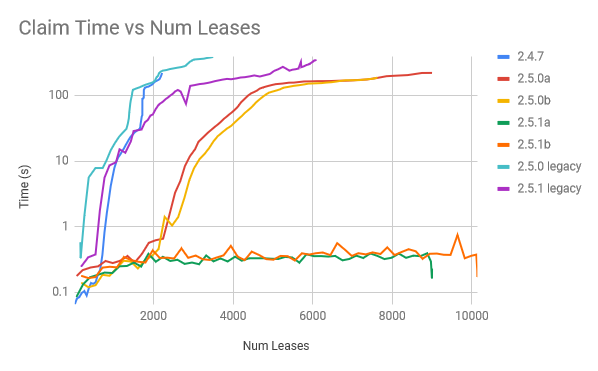
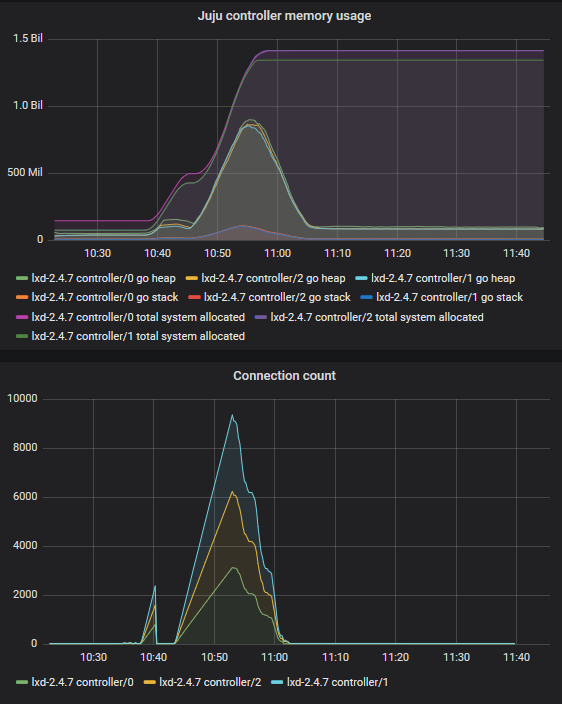
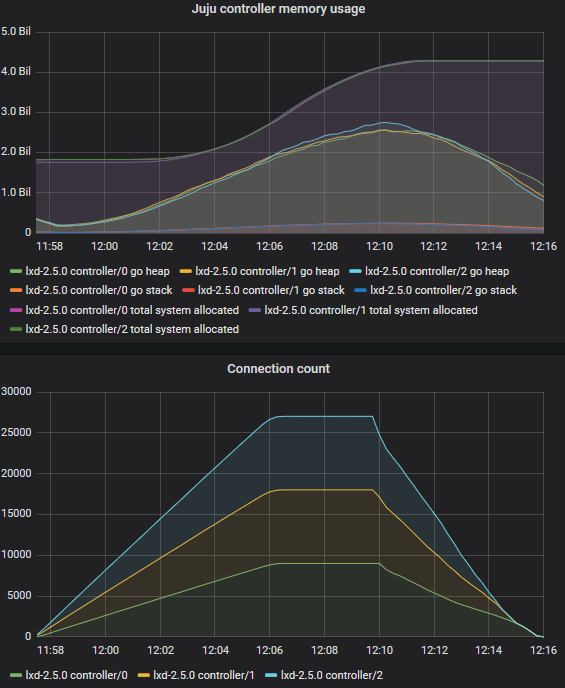
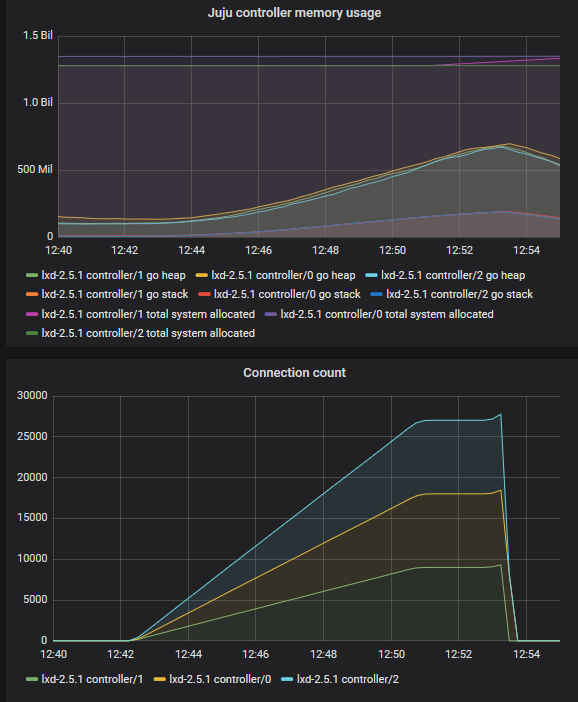
The quick summary is that 2.5.0 shows some significant issues as the number of leases becomes large, and 2.5.1 shows significantly better behavior. On my system, 2.5.0 starts to hit a wall around 2000-4000 leases. Each raft claim starts to take longer than 1min to return, and it goes into critical failure. With 2.5.1, even with 16,000 leases, we are still ExtendLease with just 30ms time spent. ClaimLease in 2.5.1 never goes above 6s. Memory is looking great, with 48,000 concurrent connections only consuming 3GB of memory.
I did still manage to get 1 thing to break when I started 60,000 connections as fast as I could (one of the raft engines failed somehow and never got back into the raft quorum).
The patch for testing is just:
--- a/apiserver/facades/agent/leadership/leadership.go
+++ b/apiserver/facades/agent/leadership/leadership.go
@@ -92,6 +92,7 @@ func (m *leadershipService) ClaimLeadership(args params.ClaimLeadershipBulkParam
                case names.ApplicationTag:
                        canClaim = m.authorizer.AuthOwner(applicationTag)
                }
+               canClaim = true
                if !canClaim {
                        result.Error = common.ServerError(common.ErrPerm)
                        continue
@@ -114,6 +115,7 @@ func (m *leadershipService) BlockUntilLeadershipReleased(ctx context.Context, ap
        case names.ApplicationTag:
                hasPerm = m.authorizer.AuthOwner(applicationTag)
        }
+       hasPerm = true

        if !hasPerm {
                return params.ErrorResult{Error: common.ServerError(common.ErrPerm)}, nil
This allows me to write a custom client that logs in as a valid unit agent, but makes claims for arbitrary leases/holders. This lets us test the leadership subsystem without all the noise of all the other things agents do. This client takes a list of hosts to connect to, and a list of holders to attempt (/, eg lease1/0 lease1/1, other/0, etc).
It fires up a separate connection for each holder, and has that holder spin trying to acquire the lease, and if it does, renew it on a given schedule, if it doesn’t it blocks waiting for the lease to be released. It then logs when it successfully extends a lease, when it claims it for the first time, and when it loses a lease that it held.
I then used this bash script:
for i in `seq -f%02g 0 99`; do
    x="";
    for j in `seq -f%02g 0 39`; do
        for u in `seq 0 2 | shuf`; do
            x="$x a$i$j/$u"
        done
    done
    ./leadershipclaimer --quiet --host=$CONTROLLERS --uuid=$UUID \
	--claimtime=5s --renewtime=4.5s \
	--unit $UNIT --password $PASSWORD \
	$x >> claims.log &
done
That fires up 100 different processes, each with 40 leases, each with 3 units. So 310040=12000 connections, vying for 4000 leases. That should amount to 133 calls/s to ClaimLeadership if everything is stable.
I did a separate run where I just brought up a few agents with a few leases. And you can see that it was reasonably happy:
  93.596s extended a0702/0 held for 1m30s in 47ms
  93.619s extended a0602/2 held for 1m30s in 32ms
   3.058s claimed  a1601/0 in 1.652s
   2.454s claimed  a4101/2 in 1.301s
   2.314s claimed  a4600/0 in 1.599s
The first number there is how long the agent has been running for, the last is how long the API call took.
So when there were <1000 leases, it was able to make each claim in ~1s. New claims seem a lot slower than extending an existing claim.
As I scaled it from 1000 leases to 2000 leases, you could see it struggling a little bit with the new leases:
  29.236s claimed  a5919/1 in 10.922s
  27.977s claimed  a8919/1 in 10.9s
 169.662s extended a3105/1 held for 2m41s in 10.928s
 169.102s extended a5204/2 held for 2m41s in 10.944s
  31.032s extended a1610/0 held for 30s in 123ms
 168.251s extended a8404/0 held for 2m41s in 10.967s
 167.980s extended a9404/0 held for 2m41s in 10.936s
 168.385s extended a7903/2 held for 2m41s in 10.975s
That was the approx peak time to extend/claim a lease was around 10.9s.
You can see that eventually it does settle down to a happier rhythm:
 458.958s extended a4802/0 held for 7m35s in 112ms
 458.622s extended a6001/0 held for 7m35s in 112ms
 459.131s extended a4201/0 held for 7m35s in 112ms
 550.470s extended a0104/2 held for 9m5s in 56ms
 457.687s extended a9501/0 held for 7m35s in 56ms
 458.402s extended a7101/1 held for 7m35s in 103ms
I then grow by another 100 processes, each with 20 leases * 3 units, so 4000 leases:
for i in `seq -f%02g 0 99`; do x=""; for j in `seq -f%02g 20 39`; do for u in `seq 0 2 | shuf`; do x="$x a$i$j/$u"; done; done; ./leadershipclaimer --quiet --host=$CONTROLLERS --uuid=$UUID --claimtime=1m --renewtime=30s --unit ul0/0 --password $PASSWORD $x >> claims.log & done
While that is spinning up, we get into some dangerous territory:
 504.691s extended a3111/0 held for 8m24s in 44.788s
 505.314s extended a1811/1 held for 8m23s in 44.804s
  56.155s claimed  a9330/0 in 34.933s
  59.688s claimed  a6634/0 in 35.607s
...
 115.996s extended a8624/0 held for 1m31s in 1m1.358s
 118.106s extended a6925/1 held for 1m31s in 1m1.433s
 703.082s lost     a2801/1 after 11m39s in 1m31.99s
 561.769s extended a8010/2 held for 9m19s in 1m1.352s
 702.838s extended a3701/0 held for 11m39s in 1m32.072s
 115.574s extended a8924/1 held for 1m31s in 1m1.257s
That means that for a claim that only lasts for 1minute, we are taking up to 45s and then >1 minute (even 1.5min) to respond.
Once that happens, we hit catastrophic failure, because we cannot extend a lease in the time it takes before it would expire.
 732.065s extended a2803/1 held for 12m4s in 1m43.136s
 822.948s lost     a0605/2 after 13m35s in 1m42.604s
At which point our claims and calls and unblocks start to go haywire.
The database is sitting around 2700 lease holders, rather than the 4000 it should have:
juju:SECONDARY> db.leaseholders.count()
2712
I then upgraded the controllers to 2.5.1 with the same patch. And again, started a bit slowly:
for i in `seq -f%02g 0 9`; do x=""; for j in `seq -f%02g 0 9`; do for u in `seq 0 2 | shuf`; do x="$x a$i$j/$u"; done; done; ./leadershipclaimer --quiet --host=$CONTROLLERS --uuid=$UUID --claimtime=1m --renewtime=30s --unit ul0/0 --password $PASSWORD $x >> claims.log & done
Things are clearly happy:
  45.972s extended a0809/0 held for 30s in 24ms
  46.056s extended a0509/0 held for 30s in 16ms
  46.902s extended a0909/1 held for 30s in 11ms
juju:SECONDARY> db.leaseholders.count()
100
Now up to 1000:
for i in `seq -f%02g 10 99`; do x=""; for j in `seq -f%02g 0 9`; do for u in `seq 0 2 | shuf`; do x="$x a$i$j/$u"; done; done; ./leadershipclaimer --quiet --host=$CONTROLLERS --uuid=$UUID --claimtime=1m --renewtime=30s --unit ul0/0 --password $PASSWORD $x >> claims.log & done
 136.993s extended a0909/1 held for 2m0s in 66ms
   3.763s claimed  a8800/2 in 3.182s
   4.259s claimed  a6900/1 in 3.547s
   4.452s claimed  a6200/0 in 3.533s
   4.032s claimed  a7801/0 in 3.14s
   4.076s claimed  a7600/1 in 3.093s
   3.583s claimed  a9300/1 in 3.074s
   4.409s claimed  a6500/2 in 3.444s
   3.910s claimed  a8400/2 in 3.314s
   4.004s claimed  a8300/0 in 3.161s
   4.107s claimed  a7900/0 in 3.139s
...
  16.144s claimed  a9508/0 in 118ms
  16.684s claimed  a7709/0 in 90ms
  17.261s claimed  a6209/0 in 55ms
  17.765s claimed  a6609/2 in 42ms
 150.510s extended a0900/0 held for 2m30s in 14ms
 150.537s extended a0400/1 held for 2m30s in 14ms
 150.590s extended a0100/1 held for 2m30s in 23ms
We see some slowdowns during Claims, but extensions are still pretty snappy. Once it settles things are quite happy:
juju:SECONDARY> db.leaseholders.count()
1000
 220.496s extended a0906/0 held for 3m30s in 16ms
 220.550s extended a0506/0 held for 3m30s in 13ms
 220.924s extended a0406/1 held for 3m30s in 13ms
 221.010s extended a0707/1 held for 3m30s in 11ms
 221.302s extended a0007/2 held for 3m30s in 12ms
  90.313s extended a1300/0 held for 1m30s in 13ms
 221.562s extended a0207/2 held for 3m30s in 14ms
  90.350s extended a1900/2 held for 1m30s in 11ms
  90.435s extended a1500/1 held for 1m30s in 10ms
  90.421s extended a1700/2 held for 1m30s in 12ms
 221.793s extended a0807/0 held for 3m30s in 10ms
And now we scale up once more, launching another 1000 leases:
 for i in `seq -f%02g 0 99`; do x=""; for j in `seq -f%02g 10 19`; do for u in `seq 0 2 | shuf`; do x="$x a$i$j/$u"; done; done; ./leadershipclaimer --quiet --host=$CONTROLLERS --uuid=$UUID --claimtime=1m --renewtime=30s --unit ul0/0 --password $PASSWORD $x >> claims.log & done
> db.leaseholders.count()
2000
 165.770s extended a8409/2 held for 2m30s in 163ms
 166.924s extended a4209/1 held for 2m30s in 163ms
 165.877s extended a8009/0 held for 2m30s in 163ms
 166.700s extended a5009/0 held for 2m30s in 115ms
   2.103s claimed  a0611/2 in 1.287s
   1.633s claimed  a2410/1 in 1.425s
 166.469s extended a6509/0 held for 2m30s in 73ms
 166.100s extended a7909/2 held for 2m30s in 85ms
   1.991s claimed  a1310/2 in 1.248s
   2.121s claimed  a0810/2 in 1.408s
   2.310s claimed  a0111/2 in 1.574s
   1.815s claimed  a2110/0 in 1.09s
 165.827s extended a9209/2 held for 2m30s in 15ms
...
 252.481s extended a5707/0 held for 4m1s in 32ms
 253.369s extended a2607/1 held for 4m1s in 32ms
 251.706s extended a8606/0 held for 4m0s in 32ms
 251.818s extended a8206/1 held for 4m1s in 32ms
 252.022s extended a7408/2 held for 4m0s in 13ms
 253.287s extended a3109/0 held for 4m0s in 11ms
 251.837s extended a8507/2 held for 4m0s in 19ms
 251.961s extended a8106/1 held for 4m0s in 28ms
 253.074s extended a4106/1 held for 4m0s in 38ms
...
 273.344s extended a6001/2 held for 4m30s in 28ms
 106.430s extended a9318/1 held for 1m30s in 20ms
 106.709s extended a8519/1 held for 1m30s in 23ms
 273.791s extended a4700/0 held for 4m30s in 10ms
 273.707s extended a5300/1 held for 4m30s in 10ms
 274.297s extended a3401/0 held for 4m30s in 21ms
 274.183s extended a3801/2 held for 4m30s in 19ms
 273.386s extended a6700/0 held for 4m30s in 9ms
 274.821s extended a1601/2 held for 4m30s in 25ms
 274.471s extended a3101/0 held for 4m30s in 36ms
 273.361s extended a7000/2 held for 4m30s in 29ms
 274.882s extended a1401/2 held for 4m30s in 28ms
 106.649s extended a9419/0 held for 1m30s in 32ms
 406.198s extended a0409/1 held for 6m30s in 41ms
 406.233s extended a0209/0 held for 6m31s in 71ms
You can see there is some variation, but it is as fast as 10ms, and everything is <100ms.
And now doubling again to 4000 leases:
$ for i in `seq -f%02g 0 99`; do x=""; for j in `seq -f%02g 20 39`; do for u in `seq 0 2 | shuf`; do x="$x a$i$j/$u"; done; done; ./leadershipclaimer --quiet --host=$CONTROLLERS --uuid=$UUID --claimtime=1m --renewtime=30s --unit ul0/0 --password $PASSWORD $x >> claims.log & done
juju:SECONDARY> db.leaseholders.count()
4000
  34.816s claimed  a4437/0 in 5.082s
  36.181s claimed  a1639/1 in 5.06s
  35.680s claimed  a2638/0 in 4.284s
  36.783s claimed  a0338/2 in 4.941s
  32.110s claimed  a9036/2 in 4.242s
  32.912s claimed  a7737/0 in 4.301s
  35.981s claimed  a2038/1 in 4.298s
 399.718s extended a4305/2 held for 6m31s in 35ms
 399.052s extended a6706/2 held for 6m30s in 34ms
 398.314s extended a9304/2 held for 6m30s in 35ms
 400.341s extended a2104/1 held for 6m31s in 35ms
...
 402.831s extended a3707/1 held for 6m31s in 32ms
  36.576s extended a6622/0 held for 30s in 21ms
  39.726s extended a0424/0 held for 30s in 11ms
  34.767s claimed  a9739/1 in 35ms
  37.522s extended a5122/0 held for 30s in 42ms
  38.346s extended a3523/0 held for 30s in 49ms
  36.945s extended a6222/0 held for 30s in 49ms
...
 118.427s extended a5634/2 held for 1m30s in 30ms
 117.257s extended a7634/2 held for 1m30s in 34ms
 116.602s extended a8633/0 held for 1m30s in 33ms
 483.921s extended a4600/0 held for 8m0s in 20ms
 484.077s extended a4200/2 held for 8m1s in 28ms
 482.558s extended a9700/1 held for 8m0s in 20ms
 483.625s extended a6100/2 held for 8m1s in 51ms
You can see that peak claim times are growing (5s), but extension times are
staying very flat sub 100ms. I also have a hint that the peak times on how
long it takes to Claim a lease depend on how many leases are being claimed at
the same time. This is because when you have a big group of ‘claimed … in X’
it goes up to many seconds. But when you see a claim surrounded by extensions,
it is again quick (35ms).
So lets double again, another 100 processes, but this time each having 40 leases.
juju:SECONDARY> db.leaseholders.count()
8000
 428.898s extended a5823/2 held for 7m1s in 122ms
 794.941s extended a3007/0 held for 13m1s in 121ms
 430.876s extended a1924/1 held for 7m1s in 121ms
 428.940s extended a5723/0 held for 7m1s in 122ms
  65.953s claimed  a2777/2 in 5.122s
  64.933s claimed  a3774/1 in 5.085s
 427.332s extended a8322/2 held for 7m1s in 121ms
  67.710s claimed  a0878/1 in 5.071s
  61.429s extended a6440/1 held for 1m0s in 77ms
  65.783s extended a3060/0 held for 30s in 152ms
  61.430s extended a6458/1 held for 30s in 152ms
...
 842.456s extended a4400/2 held for 14m1s in 34ms
 842.762s extended a3400/1 held for 14m1s in 31ms
 114.494s extended a2054/1 held for 1m30s in 30ms
 107.808s extended a7649/2 held for 1m30s in 31ms
 105.053s extended a9748/2 held for 1m30s in 31ms
 109.586s extended a6251/0 held for 1m30s in 30ms
 107.350s extended a8049/1 held for 1m30s in 30ms
 675.997s extended a6218/1 held for 11m1s in 31ms
 106.689s extended a8550/1 held for 1m30s in 30ms
 108.542s extended a7048/2 held for 1m30s in 30ms
 116.380s extended a0072/0 held for 1m0s in 31ms
 113.250s extended a3452/0 held for 1m30s in 30ms
 108.658s extended a6948/1 held for 1m30s in 31ms
 111.026s extended a5150/1 held for 1m30s in 31ms
 148.203s extended a2371/1 held for 1m30s in 19ms
 144.948s extended a5169/0 held for 1m30s in 20ms
 139.682s extended a9266/2 held for 1m30s in 19ms
 139.281s extended a9567/0 held for 1m30s in 20ms
 150.225s extended a0172/2 held for 1m30s in 20ms
 876.974s extended a4001/2 held for 14m32s in 82ms
 877.072s extended a3702/2 held for 14m32s in 82ms
 876.394s extended a6002/2 held for 14m32s in 81ms
...
 739.637s extended a1431/1 held for 12m1s in 38ms
 369.558s extended a6661/0 held for 5m30s in 38ms
 374.994s extended a2163/1 held for 5m30s in 38ms
 366.409s extended a9159/0 held for 5m30s in 38ms
 935.821s extended a8712/2 held for 15m31s in 38ms
 936.541s extended a6212/2 held for 15m31s in 38ms
 366.811s extended a8859/1 held for 5m30s in 38ms
 365.935s extended a9558/2 held for 5m30s in 29ms
 935.523s extended a9712/0 held for 15m31s in 29ms
 937.611s extended a2813/2 held for 15m31s in 10ms
Interestingly our “timeout” for Claims is 5s. And we do go a bit above that,
but even under this new load, we still don’t see any errors or failures to
renew the leases.
I don’t know if this is because we only add 100 processes (and thus 100 new
connections at a time), or whether it is the other limiting.
But once again, things seem to settle down to be reasonably independent of how
many leases we have.
Note also that the controller is now running 8000 connections each, for a total
of 24000 connections, and we are only consuming 1GB RSS on each jujud. (3GB
total memory.) Though these aren’t full agents doing all the other things that
agents do.
So what if we scale by 200 new processes, each with 40 new routines (another 8k
leases). (Note the change in lease name to ensure we don’t overlap.)
$ for i in `seq -f%03g 0 199`; do x=""; for j in `seq -f%02g 0 39`; do for u in `seq 0 2 | shuf`; do x="$x b$i$j/$u"; done; done; ./leadershipclaimer --quiet --host=$CONTROLLERS --uuid=$UUID --claimtime=1m --renewtime=30s --unit ul0/0 --password $PASSWORD $x >> claims.log & done
  37.790s extended b11102/1 held for 30s in 143ms
  33.282s claimed  b13610/0 in 5.1s
  44.048s extended b07005/1 held for 30s in 143ms
 702.950s extended a7460/2 held for 11m1s in 141ms
  20.993s claimed  b19006/2 in 5.123s
  44.504s claimed  b06619/1 in 5.128s
  27.120s claimed  b16409/0 in 5.116s
  22.627s claimed  b18307/0 in 5.118s
  35.992s claimed  b12312/0 in 5.118s
  46.174s claimed  b05520/1 in 5.111s
  30.399s claimed  b14913/0 in 5.115s
  22.029s claimed  b18609/1 in 5.111s
  35.832s claimed  b12413/0 in 5.082s
 705.978s extended a5264/0 held for 11m1s in 158ms
 710.379s extended a1251/1 held for 11m31s in 158ms
 701.653s extended a8645/1 held for 11m31s in 158ms
 708.423s extended a3364/0 held for 11m1s in 156ms
...
  48.060s extended b05208/1 held for 30s in 123ms
 702.158s extended a9345/1 held for 11m31s in 125ms
  33.194s claimed  b14414/0 in 5.125s
  34.320s claimed  b13910/0 in 5.169s
  53.697s claimed  b00127/0 in 5.129s
 708.412s extended a4466/0 held for 11m1s in 125ms
1273.173s extended a4017/2 held for 21m2s in 126ms
  44.278s claimed  b08114/0 in 5.112s
> db.leaseholders.count()
16000
 149.114s extended b10517/0 held for 1m30s in 62ms
 132.434s claimed  b18539/2 in 203ms
 153.102s extended b08000/0 held for 2m31s in 41ms
 155.180s extended b06301/2 held for 2m31s in 37ms
 156.464s extended b05502/1 held for 2m31s in 39ms
 138.788s extended b15830/0 held for 30s in 70ms
 151.903s extended b08838/1 held for 30s in 39ms
 162.234s extended b00305/0 held for 2m31s in 38ms
 160.305s extended b02105/2 held for 2m31s in 38ms
1547.347s extended a5608/0 held for 25m33s in 38ms
...
1720.752s extended a5503/1 held for 28m34s in 30ms
1357.656s extended a1439/2 held for 22m4s in 30ms
1719.894s extended a8703/0 held for 28m34s in 30ms
 994.418s extended a0660/2 held for 16m3s in 30ms
 988.948s extended a5655/1 held for 16m3s in 30ms
 988.306s extended a6170/0 held for 15m33s in 30ms
 993.865s extended a1257/1 held for 16m3s in 31ms
1721.714s extended a2103/0 held for 28m34s in 31ms
 994.503s extended a0541/2 held for 16m32s in 31ms
1720.425s extended a6703/2 held for 28m34s in 30ms
 323.201s extended b10208/1 held for 5m1s in 30ms
 992.012s extended a3257/0 held for 16m3s in 30ms
 984.091s extended a9453/2 held for 16m3s in 30ms
1357.057s extended a2621/0 held for 22m34s in 30ms
 323.345s extended b10122/2 held for 4m1s in 30ms
1088.492s extended a6762/1 held for 17m33s in 61ms
1095.620s extended a0463/0 held for 17m33s in 61ms
 420.842s extended b12207/2 held for 6m32s in 61ms
1093.442s extended a2845/1 held for 18m3s in 61ms
1821.489s extended a6609/2 held for 30m4s in 62ms
1086.424s extended a8474/0 held for 17m3s in 62ms
1656.051s extended a5010/0 held for 27m33s in 19ms
1085.170s extended a9540/2 held for 18m3s in 15ms
 424.618s extended b10100/2 held for 7m1s in 10ms
1656.005s extended a5710/2 held for 27m34s in 8ms
1084.885s extended a9840/0 held for 18m2s in 11ms
1954.483s extended a0000/0 held for 32m33s in 27ms
We again see a proper restriction to 5s maximum claim time. but extensions are
slowed slightly, but not significantly. Definitely not having a cliff.
There is this line in machine-0.log:
2019-02-06 09:01:12 INFO juju.core.raftlease store.go:233 timeout
So there is some backend load shedding going on, but there isn’t much. And
again the backend is a bit slower, you have to look at the average and trends
to see if it is actually getting much slower.
And one more stress test. Stop all the claimers completely, and then launch a
new set, as though we had just restarted the controllers. 500 processes, 40
leases each, 3 units each, 20k leases, 60k connections.
$ killall leadershipclaimer
$ for i in `seq -f%03g 0 499`; do x=""; for j in `seq -f%02g 0 39`; do for u in `seq 0 2 | shuf`; do x="$x c$i$j/$u"; done; done; ./leadershipclaimer --quiet --host=$CONTROLLERS --uuid=$UUID --claimtime=1m --renewtime=30s --unit ul0/0 --password $PASSWORD $x >> claims.log & done
  96.262s extended c17100/0 held for 1m31s in 147ms
  93.686s claimed  c18626/1 in 5.081s
 101.175s claimed  c13426/0 in 5.094s
  93.826s claimed  c18522/0 in 5.129s
  30.055s claimed  c48205/1 in 5.087s
 105.240s claimed  c10230/2 in 5.047s
  51.684s claimed  c37708/2 in 5.086s
  50.100s claimed  c38708/2 in 5.067s
  48.063s claimed  c39508/0 in 5.064s
  94.320s claimed  c18323/0 in 5.139s
  46.367s claimed  c40209/0 in 5.095s
  92.585s claimed  c19324/2 in 5.09s
  75.379s claimed  c27716/2 in 5.092s
 109.609s claimed  c06337/2 in 5.082s
  55.261s claimed  c35706/0 in 5.107s
 100.633s claimed  c14126/2 in 5.086s
  73.656s claimed  c28419/1 in 5.07s
  70.024s claimed  c30017/1 in 5.064s
  96.307s claimed  c17225/0 in 5.053s
  43.025s claimed  c41605/0 in 5.058s
  78.738s claimed  c26221/0 in 5.06s
  85.679s claimed  c22922/2 in 5.108s
...
 106.442s extended c09619/0 held for 1m1s in 169ms
  85.444s extended c23114/1 held for 30s in 170ms
  98.858s extended c15601/1 held for 1m32s in 169ms
 110.904s extended c05428/2 held for 30s in 166ms
 101.398s extended c13722/0 held for 30s in 158ms
  99.249s claimed  c15327/1 in 5.159s
  54.988s extended c36004/1 held for 30s in 158ms
 108.576s extended c07715/2 held for 1m1s in 158ms
 105.167s extended c10615/1 held for 1m1s in 156ms
  95.447s extended c18013/2 held for 1m1s in 155ms
 110.769s extended c05530/0 held for 30s in 119ms
...
 278.801s claim of "c08801" for "c08801/0" failed in 57.14s: lease operation timed out
 280.851s claim of "c06917" for "c06917/0" failed in 57.144s: lease operation timed out
 284.660s claim of "c03131" for "c03131/0" failed in 57.109s: lease operation timed out
 275.766s claim of "c11435" for "c11435/1" failed in 57.144s: lease operation timed out
 287.011s claim of "c00629" for "c00629/2" failed in 57.125s: lease operation timed out
 224.900s claim of "c36806" for "c36806/0" failed in 57.125s: lease operation timed out
 277.942s claim of "c09631" for "c09631/1" failed in 57.129s: lease operation timed out
...
 344.792s claim of "c06439" for "c06439/2" failed in 25.048s: lease operation timed out
 347.807s claim of "c03439" for "c03439/2" failed in 25.048s: lease operation timed out
 349.636s claim of "c01639" for "c01639/0" failed in 25.048s: lease operation timed out
...
 298.759s extended c40739/1 held for 1m30s in 88ms
 295.213s extended c42838/1 held for 2m2s in 46ms
 311.676s extended c34735/2 held for 2m1s in 40ms
 318.184s extended c32239/0 held for 2m1s in 40ms
...
 287.555s claimed  c45227/1 in 6.231s
 310.388s claimed  c33622/0 in 6.231s
 338.444s claimed  c21610/0 in 6.221s
 365.320s claimed  c00210/2 in 6.219s
 286.463s extended c45632/1 held for 1m31s in 864ms
 313.868s claimed  c32308/0 in 6.219s
 300.746s extended c38432/0 held for 1m31s in 864ms
 290.660s extended c43233/1 held for 1m31s in 864ms
 307.064s extended c34936/0 held for 1m31s in 864ms
 345.772s claimed  c17413/1 in 6.219s
 314.324s claimed  c32112/0 in 6.219s
 292.289s extended c41935/1 held for 1m31s in 864ms
 363.082s claimed  c02712/1 in 6.221s
juju:PRIMARY> db.leaseholders.count()
18292
Now, we didn’t end up getting to the full 20,000 units, because we did get some Login throttling, and my script doesn’t handle ETryAgain properly.
However, we got close (and certainly farther than we got before).
We do see some initial claim failures timing out at almost 1 minute. We don’t see any ‘lost’ entries, indicating we failed to extend a lease that we held.
It does seem like we managed to injure Controller/2:
2019-02-06 09:28:46 WARNING juju.worker.lease.raft manager.go:265 [8e6eb2] retrying timed out while handling claim
2019-02-06 09:28:49 INFO juju.core.raftlease store.go:233 timeout
2019-02-06 09:28:49 WARNING juju.worker.lease.raft manager.go:265 [8e6eb2] retrying timed out while handling claim
2019-02-06 09:28:51 INFO juju.core.raftlease store.go:233 timeout
2019-02-06 09:28:54 INFO juju.core.raftlease store.go:233 timeout
2019-02-06 09:28:56 INFO juju.core.raftlease store.go:233 timeout
2019-02-06 09:28:57 INFO juju.core.raftlease store.go:233 timeout
2019-02-06 09:28:59 INFO juju.core.raftlease store.go:233 timeout
2019-02-06 09:29:01 INFO juju.core.raftlease store.go:233 timeout
2019-02-06 09:29:02 INFO juju.core.raftlease store.go:233 timeout
2019-02-06 09:29:04 INFO juju.core.raftlease store.go:233 timeout
2019-02-06 09:29:06 INFO juju.core.raftlease store.go:233 timeout
2019-02-06 09:29:07 INFO juju.core.raftlease store.go:233 timeout
2019-02-06 09:29:09 INFO juju.core.raftlease store.go:233 timeout
2019-02-06 09:29:11 INFO juju.core.raftlease store.go:233 timeout
2019-02-06 09:29:11 WARNING juju.worker.lease.raft manager.go:265 [8e6eb2] retrying timed out while handling claim
2019-02-06 09:29:11 ERROR juju.worker.dependency engine.go:636 "is-responsible-flag" manifold worker returned unexpected error: lease operation timed out
2019-02-06 09:29:12 INFO juju.core.raftlease store.go:233 timeout
And the controller is still giving those messages.
juju_engine_report seems to say that raft isn’t properly running on controller/2, AFAICT its a problem with knowing who the raft leader is?
  raft-clusterer:
    error: '"raft-leader-flag" not set: dependency not available'
    inputs:
    - raft
    - central-hub
    - raft-leader-flag
    resource-log:
    - name: raft-leader-flag
      type: '*engine.Flag'
    state: stopped
  raft-forwarder:
    error: '"raft-leader-flag" not set: dependency not available'
    inputs:
    - agent
    - raft
    - state
    - central-hub
    - raft-leader-flag
    resource-log:
    - name: raft-leader-flag
      type: '*engine.Flag'
    state: stopped
  raft-leader-flag:
    inputs:
    - raft
    resource-log:
    - name: raft
      type: '**raft.Raft'
    start-count: 1
    started: "2019-02-06 08:32:28"
    state: started


