Welcome to the guide on how to deploy the MLflow bundle with the Canonical Observability Stack (COS)!
Prerequisites: Before proceeding with this guide, make sure you have completed the following prerequisites on your computer:
- Deploy the COS stack in the
cosmodel by following the instructions in this COS installation guide. - Deploy the MLflow bundle in the
kubeflowmodel using the instructions provided in this MLflow deployment guide.
Contents:
- Deploy Grafana Agent
- Relate MLflow Server Prometheus Metrics to Grafana Agent
- Relate Grafana Agent to Prometheus in the COS Model
- Relate MLflow Server in the Kubeflow Model to Grafana Charm in the COS Model
- Obtain the Grafana Dashboard Admin Password
- Obtain the Grafana Dashboard URL
- Login to Grafana
- Access the dashboard in the UI
Deploy Grafana Agent
Deploy the Grafana Agent to yourkubeflow model alongside the MLflow bundle. Run the following command:
juju deploy grafana-agent-k8s --channel=edge --trust
Relate MLflow Server Prometheus Metrics to Grafana Agent
Establish the relationship between the MLflow Server Prometheus metrics and the Grafana Agent. Use the following command:juju add-relation mlflow-server:metrics-endpoint grafana-agent-k8s:metrics-endpoint
Relate Grafana Agent to Prometheus in the COS Model
Next, relate the Grafana Agent to Prometheus in thecos model. Execute the following command:
juju add-relation grafana-agent-k8s admin/cos.prometheus-receive-remote-write
Relate MLflow Server in the Kubeflow Model to Grafana Charm in the COS Model
Establish the relationship between the MLflow Server in thekubeflow model and the Grafana charm in the cos model. Run the following command:
juju add-relation mlflow-server admin/cos.grafana-dashboards
Obtain the Grafana Dashboard Admin Password
Switch the model tocos and retrieve the Grafana dashboard admin password. Execute the following commands:
juju switch cos
juju run-action grafana/0 get-admin-password --wait
Obtain the Grafana Dashboard URL
To access the Grafana dashboard, you need the URL. Run the following command to get the URLs for the COS endpoints:juju show-unit catalogue/0 | grep url
You will see a list of endpoints similar to the following:
url: http://10.43.8.34:80/cos-catalogue
url: http://10.43.8.34/cos-grafana
url: http://10.43.8.34:80/cos-prometheus-0
url: http://10.43.8.34:80/cos-alertmanager
Choose the cos-grafana URL and access it in your browser.
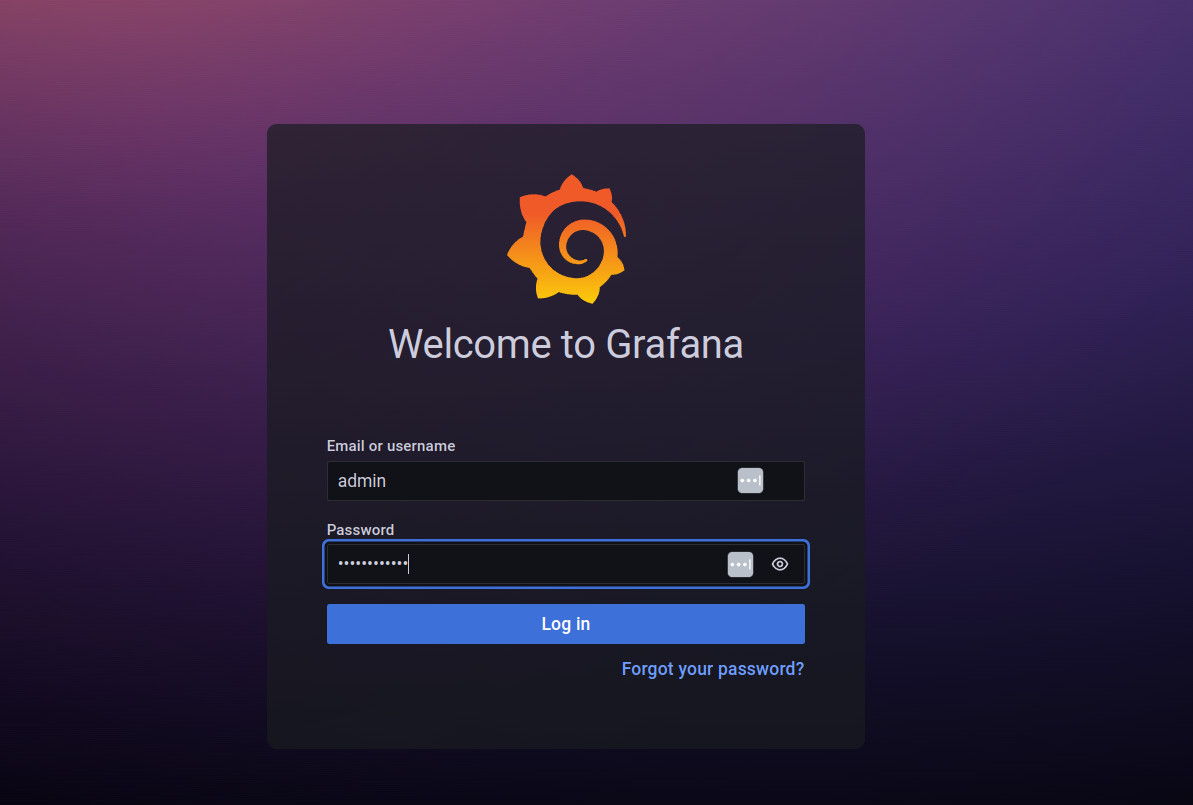
Login to Grafana
Login to Grafana with the password obtained from the previous section. The username isadmin .
Access the dashboard in the UI
Go to the left sidebar and choose the MLflow Dashboards from the list.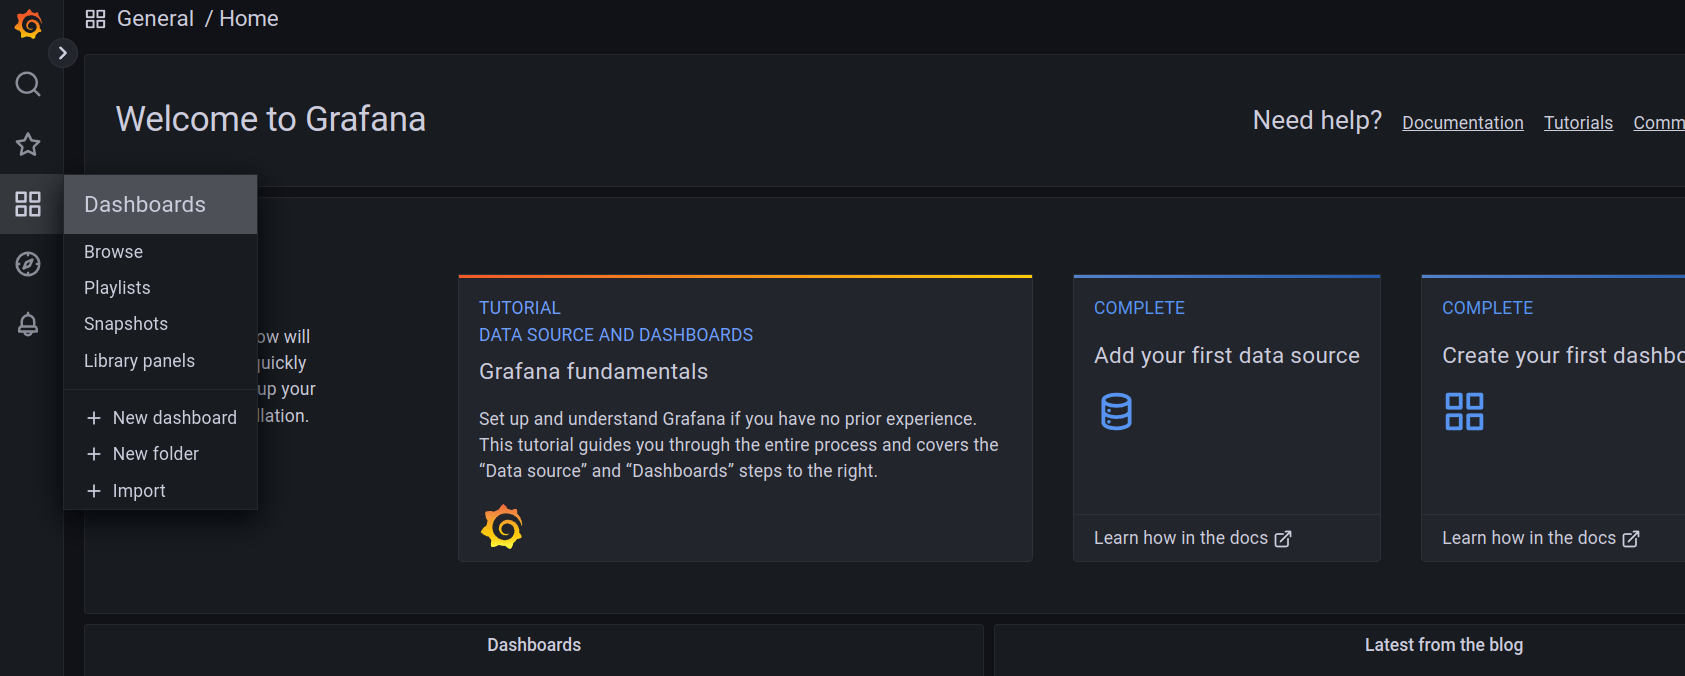
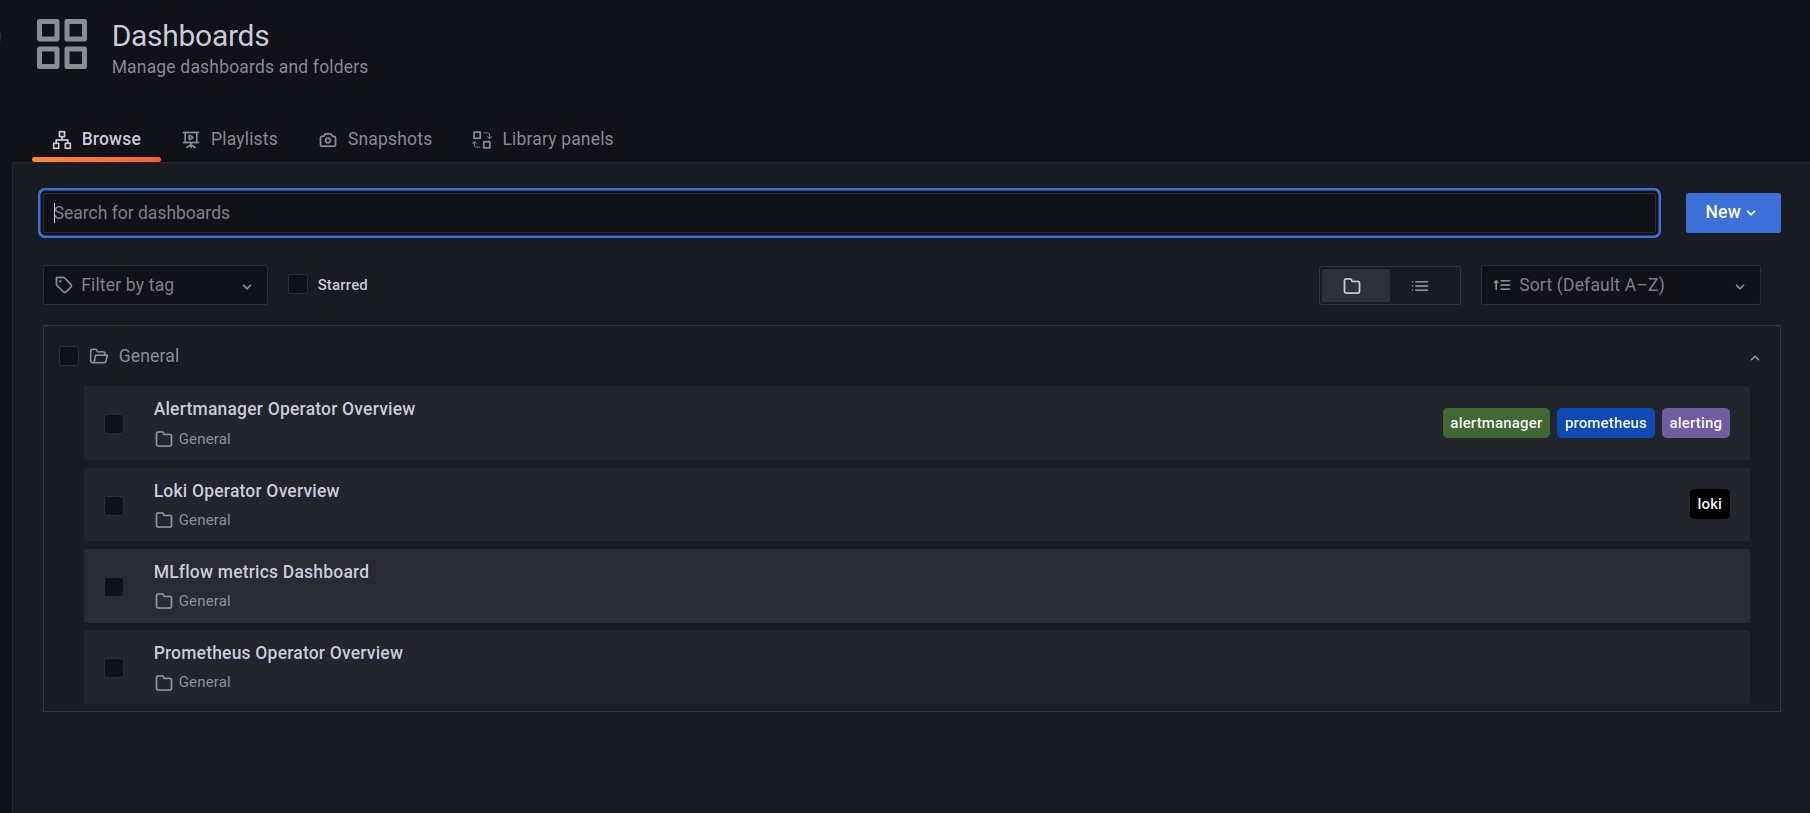
From the General dashboards folder choose the MLflow metrics Dashboard
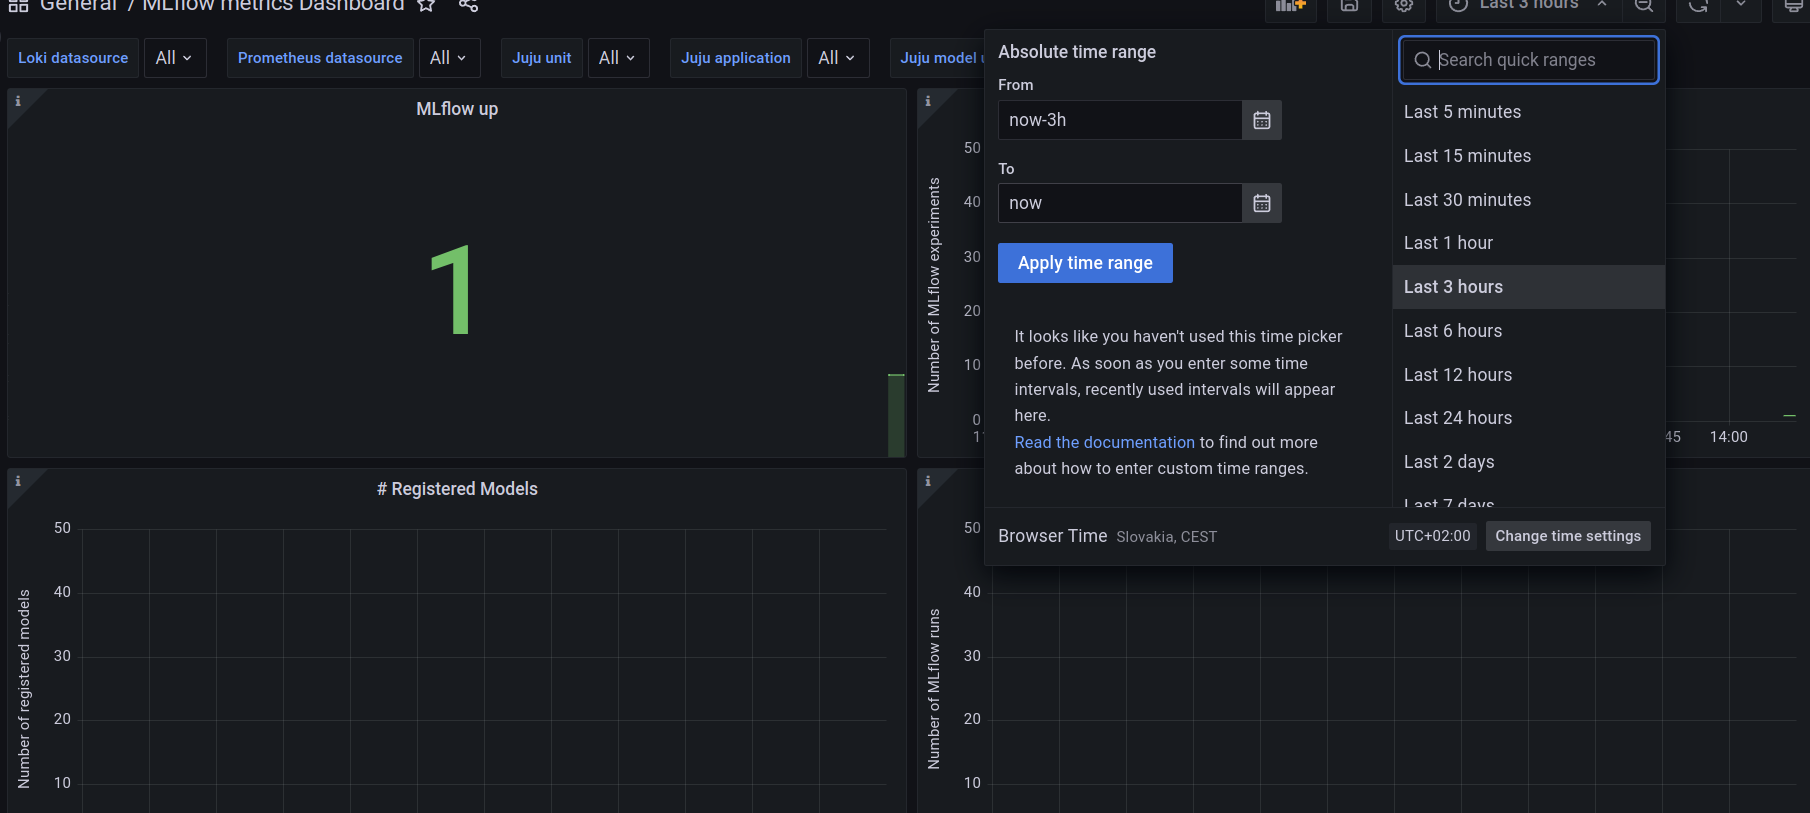
When accessing the dashboard for the first time choose some reasonable time range from the top right drop down.