
This document will introduce you to all you need to know to get started with version 2 of Charmed MLflow along Charmed Kubeflow version 1.7. If you would like to deploy Kubeflow by itself, see our tutorial on Charmed Kubeflow.
Prerequisites:
This tutorial assumes you will be deploying Kubeflow and MLflow on a public cloud VM with the following specs:
- Runs Ubuntu 20.04 (focal) or later.
- Has at least 4 cores, 32GB RAM and 100GB of disk space available.
- Is connected to the internet for downloading the required snaps and charms.
We’ll also assume that you have a laptop that meets the following conditions:
- Has an SSH tunnel open to the VM with port forwarding and a SOCKS proxy. To see how to set this up, see How to setup SSH VM Access.
- Runs Ubuntu 20.04 (focal) or later.
- Has a web browser installed e.g. Chrome / Firefox / Edge.
In the remainder of this tutorial, unless otherwise stated, it is assumed you will be running all command line operations on the VM, through the open SSH tunnel. It’s also assumed you’ll be using the web browser on your local machine to access the Kubeflow and MLflow dashboards.
Note: with a few tweaks to the instructions, it is possible to do this entire tutorial on a laptop, but running it on a VM will give you a better feel for deploying Kubeflow and MLflow in production. So, we recommend using the VM, even if your laptop is powerful enough to deploy Kubeflow.
Contents:
- Deploy MLflow
- Deploy Kubeflow bundle
- Configure Dashboard Access
- Deploy Resource Dispatcher
- Integrate MLflow with Notebook
Deploy MLflow
Follow the steps in this tutorial to deploy MLflow on your VM: Get Started with Charmed MLflow v2. Before moving on with this tutorial, confirm that you can now access the MLflow UI on http://localhost:31380.
Deploy Kubeflow bundle
Let’s deploy Charmed Kubeflow alongside MLflow. Run the following command to initiate the deployment:
juju deploy kubeflow --trust --channel=1.7/stable
Be patient. Kubeflow is large and will take a few minutes to deploy.
Configure Dashboard Access
Run the following commands:
juju config dex-auth public-url=http://10.64.140.43.nip.io
juju config oidc-gatekeeper public-url=http://10.64.140.43.nip.io
This tells the authentication and authorization components of the bundle that users who access the bundle will be doing so via the URL http://10.64.140.43.nip.io. In turn, this allows those components to construct appropriate responses to incoming traffic.
Now set the dashboard username and password:
juju config dex-auth static-username=user123@email.com
juju config dex-auth static-password=user123
Deploy Resource Dispatcher
Next let’s deploy the resource dispatcher. The resource dispatcher is an optional component which will distribute kubernetes objects related to mlflow credentials to all user namespaces in Kubeflow. This means that all your Kubeflow users can access the MLflow model registry from their namespaces. To deploy the dispatcher run the following command:
juju deploy resource-dispatcher --channel edge --trust
This will deploy the latest edge version of the dispatcher. See Resource Dispatcher on GitHub for more info. Now we must relate the dispatcher to mlflow:
juju relate mlflow-server:secrets resource-dispatcher:secrets
juju relate mlflow-server:pod-defaults resource-dispatcher:pod-defaults
Now, at this point, we’ve deployed MLflow, Kubeflow and the resource dispatcher. But that doesn’t mean our system is ready yet: Juju will need to download charm data from CharmHub and the charms themselves will take some time to initialise.
So, how do you know when all the charms are ready, then? You can do this using the juju status command. First, let’s run a basic status command and review the output. Run the following command to print out the status of all the components of Juju:
juju status
Review the output for yourself. You should see some summary information, a list of Apps and associated information, and another list of Units and their associated information. Don’t worry too much about what this all means for now. If you’re interested in learning more about this command and its output, see the Juju Status command.
The main thing we’re interested in at this stage is the statuses of all the applications and units running through Juju. We want all the statuses to eventually become active, indicating that the bundle is ready. Run the following command to keep a watch on the components which are not active yet:
watch -c 'juju status --color | grep -E "blocked|error|maintenance|waiting|App|Unit"'
This will periodically run a juju status command and filter to components which are in a state of blocked, error, maintenance or waiting i.e not active. When this output becomes empty except for the “App” and “Unit” headings, then we know all statuses are active and our system is ready.
Don’t be surprised if some of the components’ statuses change to blocked or error every now and then. This is expected behaviour, and these statuses should resolve by themselves as the bundle configures itself. However, if components remain stuck in the same error states for more than 5 minutes or so, consult the troubleshooting steps below.
Expand to troubleshoot: Waiting for gateway relation
An issue you might have is the tensorboard-controller component might be stuck with a status of waiting and a message “Waiting for gateway relation”. To fix this, run:
juju run --unit istio-pilot/0 -- "export JUJU_DISPATCH_PATH=hooks/config-changed; ./dispatch"
This is a known issue, see tensorboard-controller GitHub issue for more info.
Be patient, it can take up to an hour for all those charms to download and initialise. In the meantime, why not try our Juju tutorial?
Integrate MLflow with Notebook
In this section, we’re going to create a notebook server in Kubeflow and connect it to MLflow. This will allow our notbook logic to talk to MLFlow in the background. Let’s get started.
First, to be able to use MLflow credentials in your Kubeflow notebook, visit the dashboard at http://10.64.140.43.nip.io/ and fill the username and password which you configured in the previous section e.g. user123@email.com and user123. You should now see the following screen.
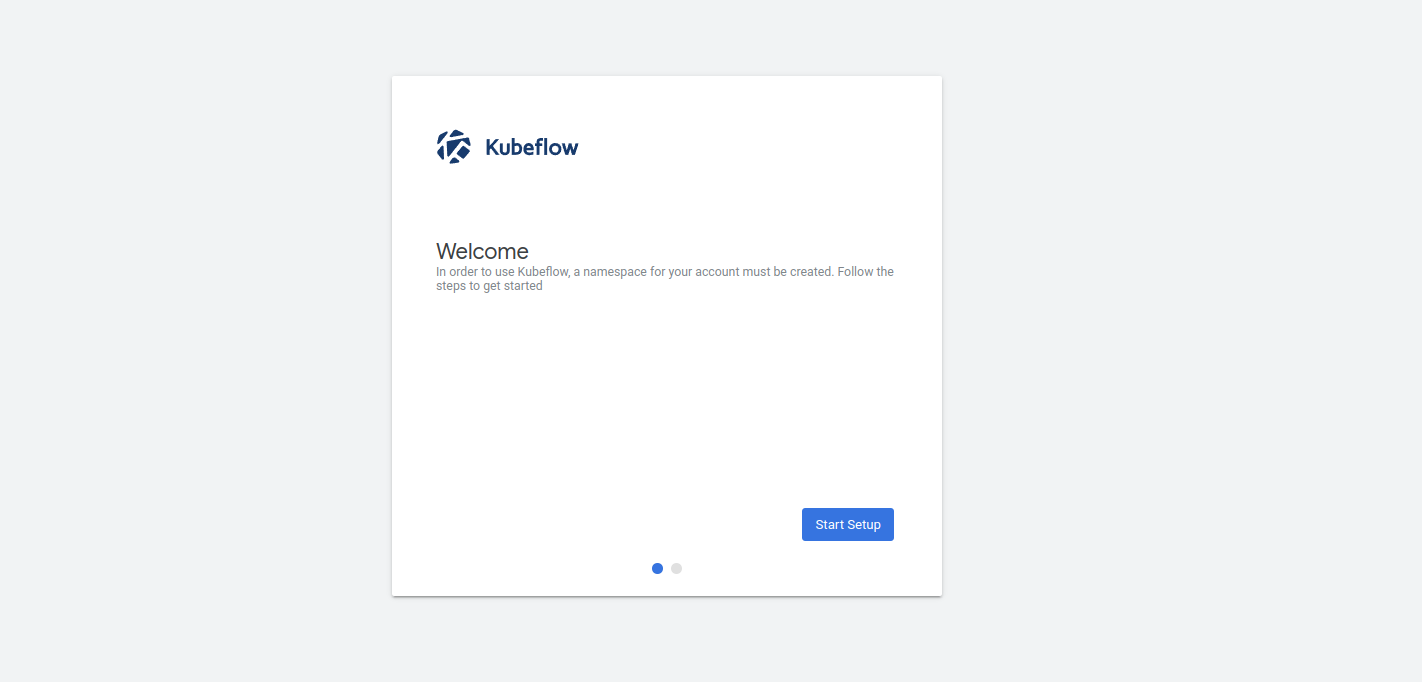
Click on start setup to setup the Kubeflow user for the first time.
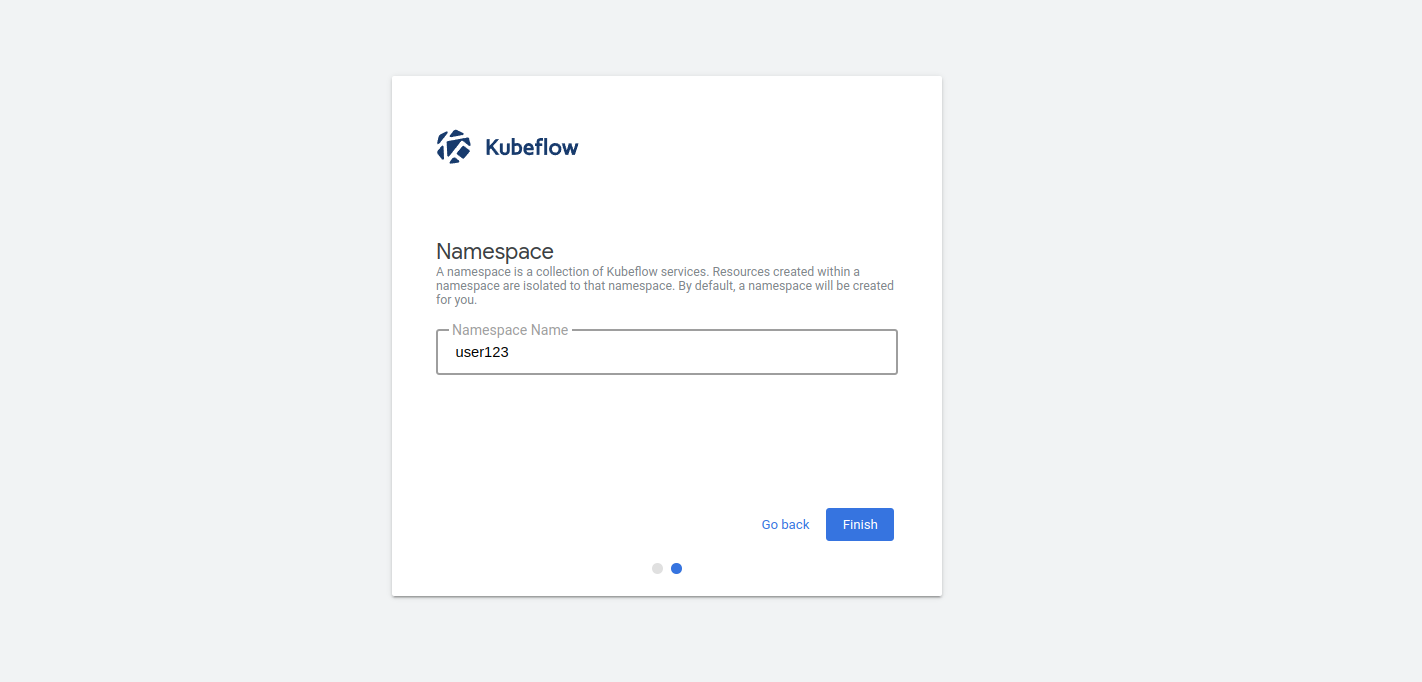
Select Finish to finish the process.
Now a Kubernetes namespace was created for your user.
Now go back to the Dashboard.
From the left panel choose notebooks. Select +New Notebook. At this point, we can name the notebook as we want, and choose the desired image and resource limits. For now, let’s just keep things simple: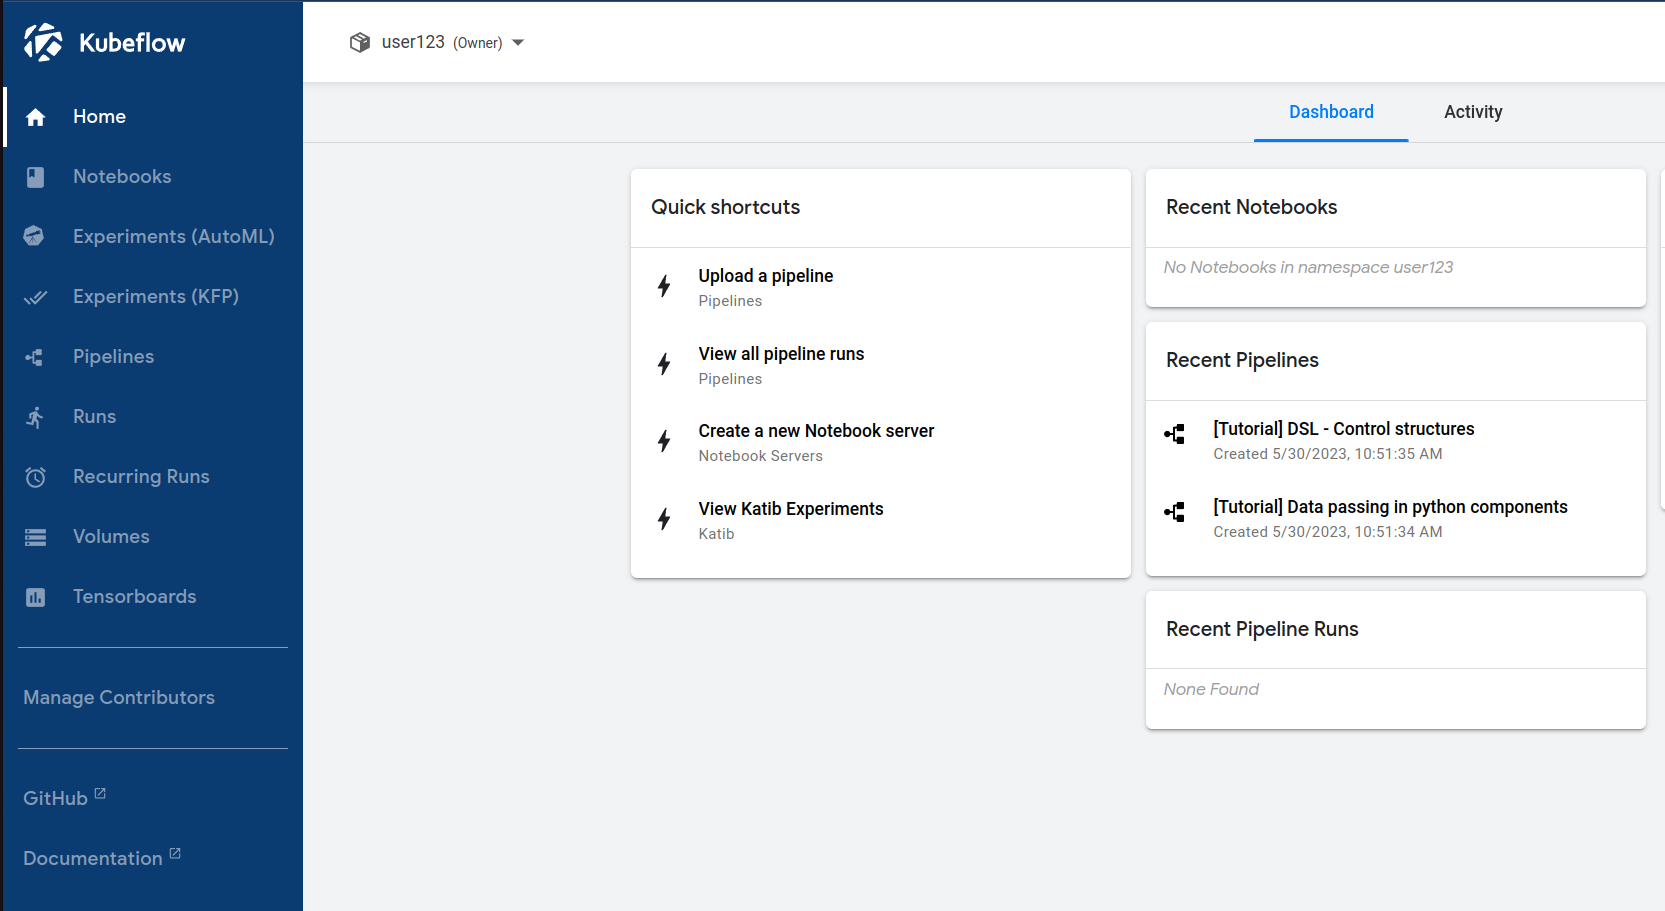
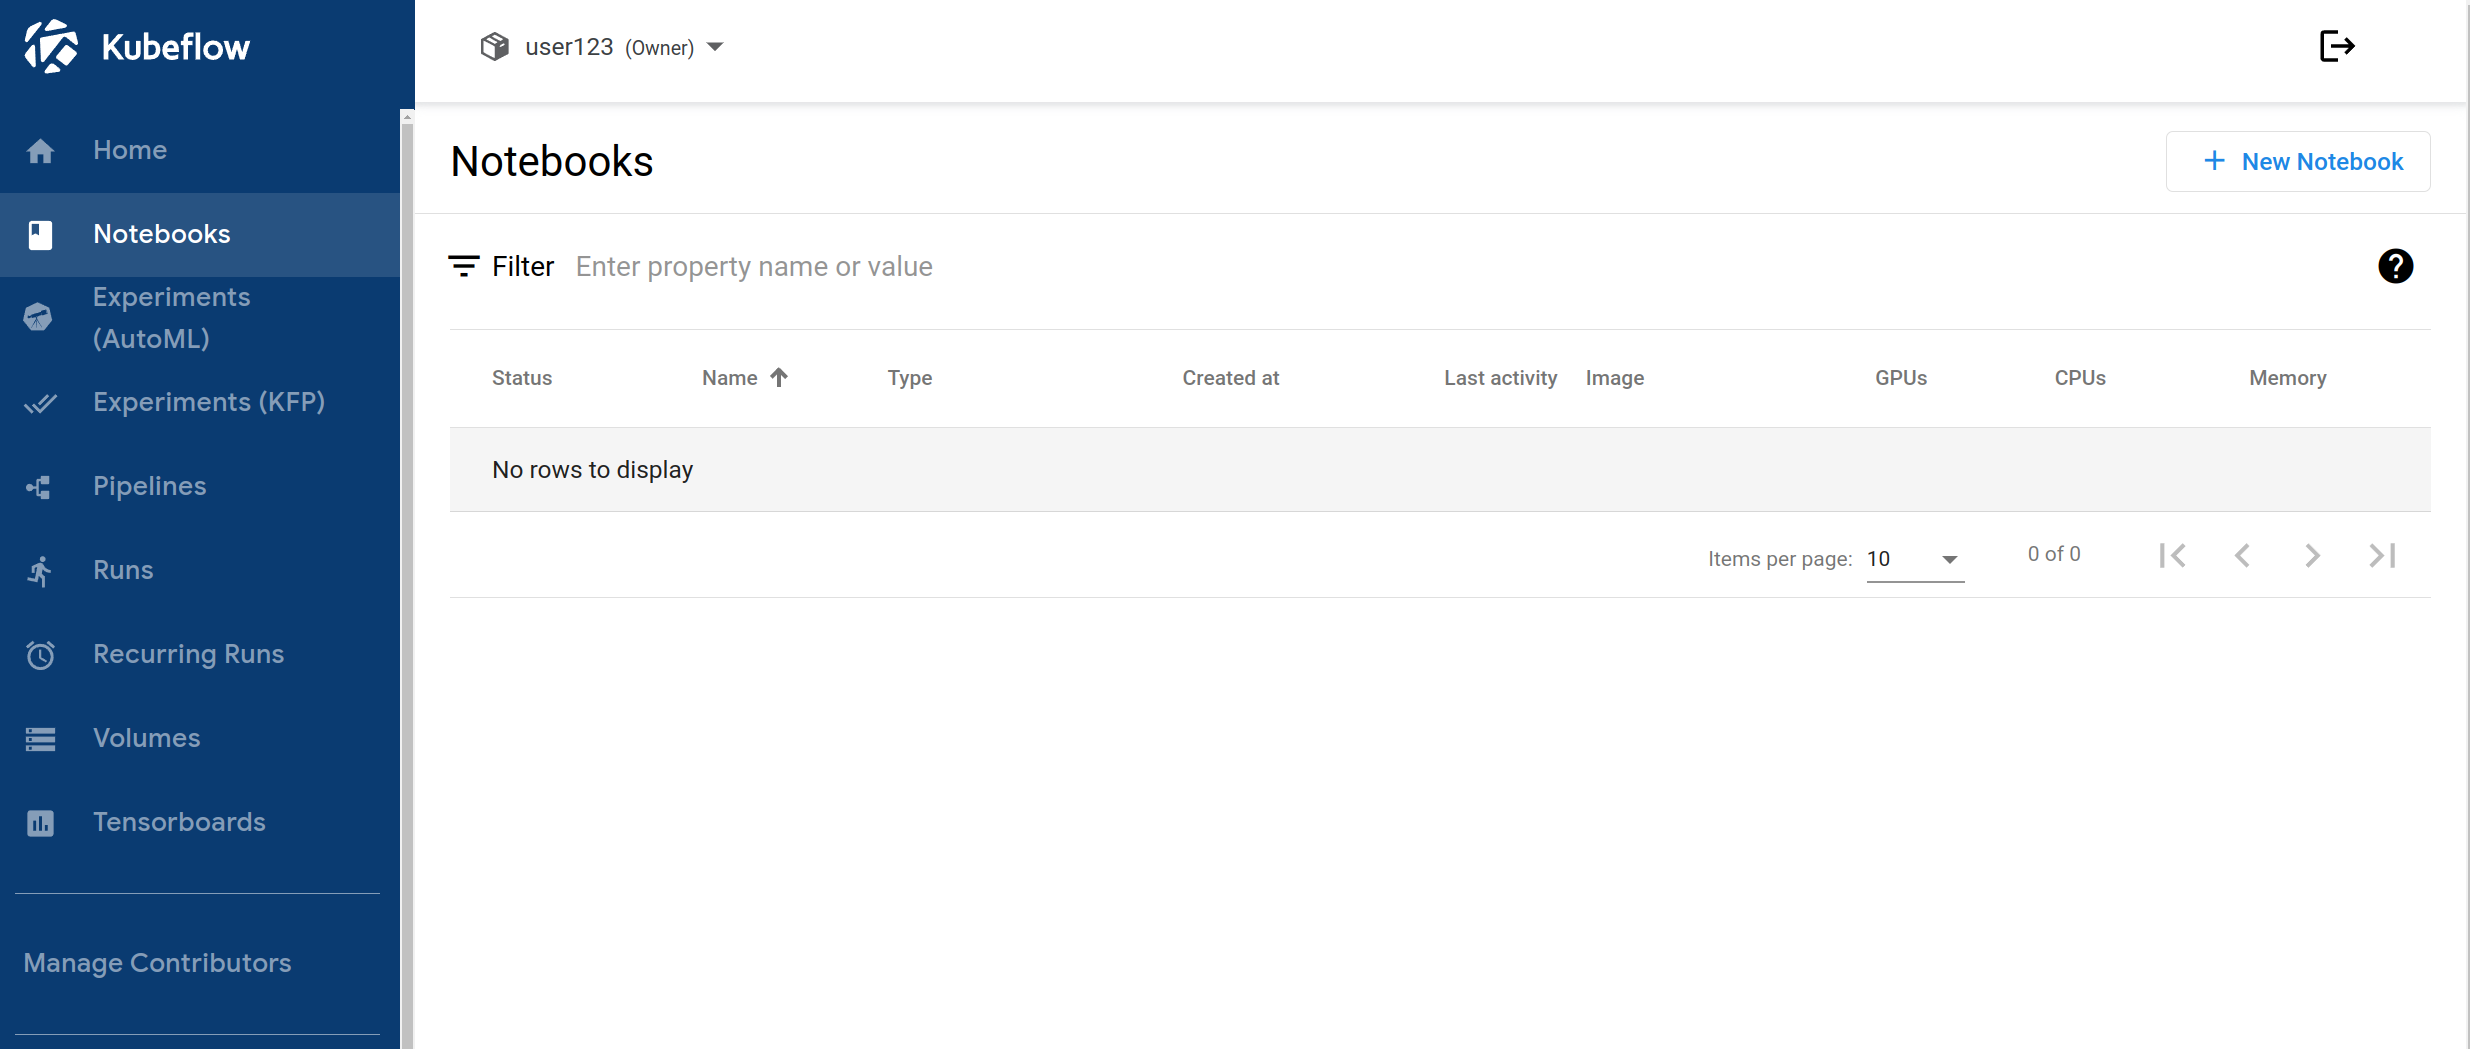
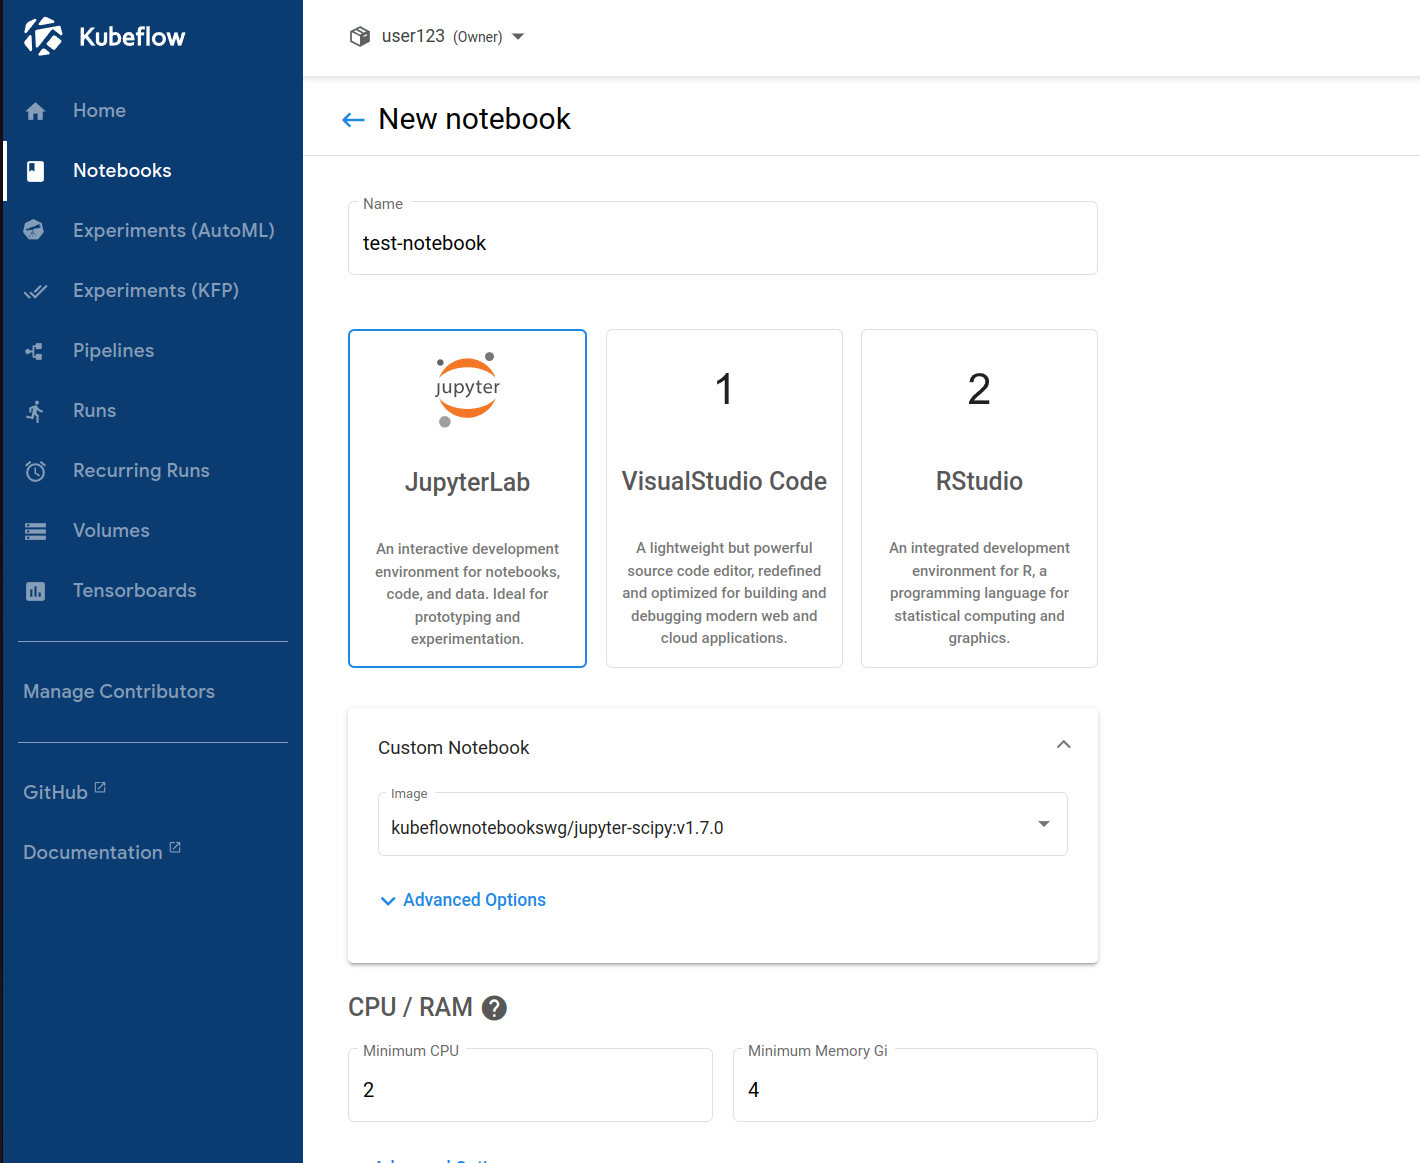
- For
Nameentertest-notebook. - Expand the Custom Notebook section and for
imageselectkubeflownotebookswg/jupyter-tensorflow-full:v1.7.0.
Now, in order to allow our notebook server access to MLflow, we need to enable some special configuration options. Scroll down to Data Volumes -> Advanced options and from the Configurations drop down choose the following options:
- Allow access to Kubeflow pipelines.
- Allow access to Minio.
- Allow access to MLflow.
Note: remember we related the resource dispatcher to MLflow earlier? This is why we’re seeing the Minio and MLflow options in the dropdown!
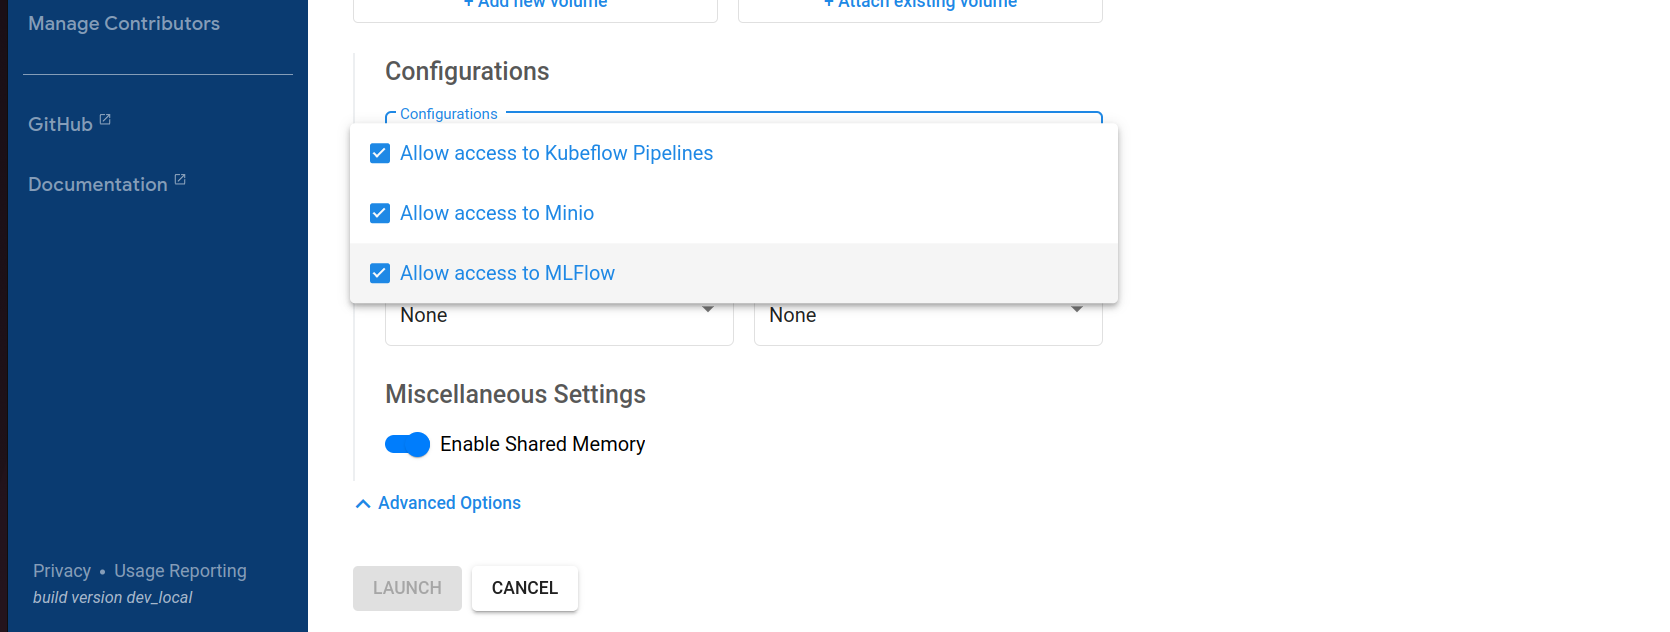
Great, that’s all the configuration for the notebook server done. Hit the Launch button to launch the notebook server. Be patient, the notebook server will take a little while to initialise.
When the notebook server is ready, you’ll see it listed in the Notebooks table with a success stauts. At this point, select Connect to connect to the notebook server.
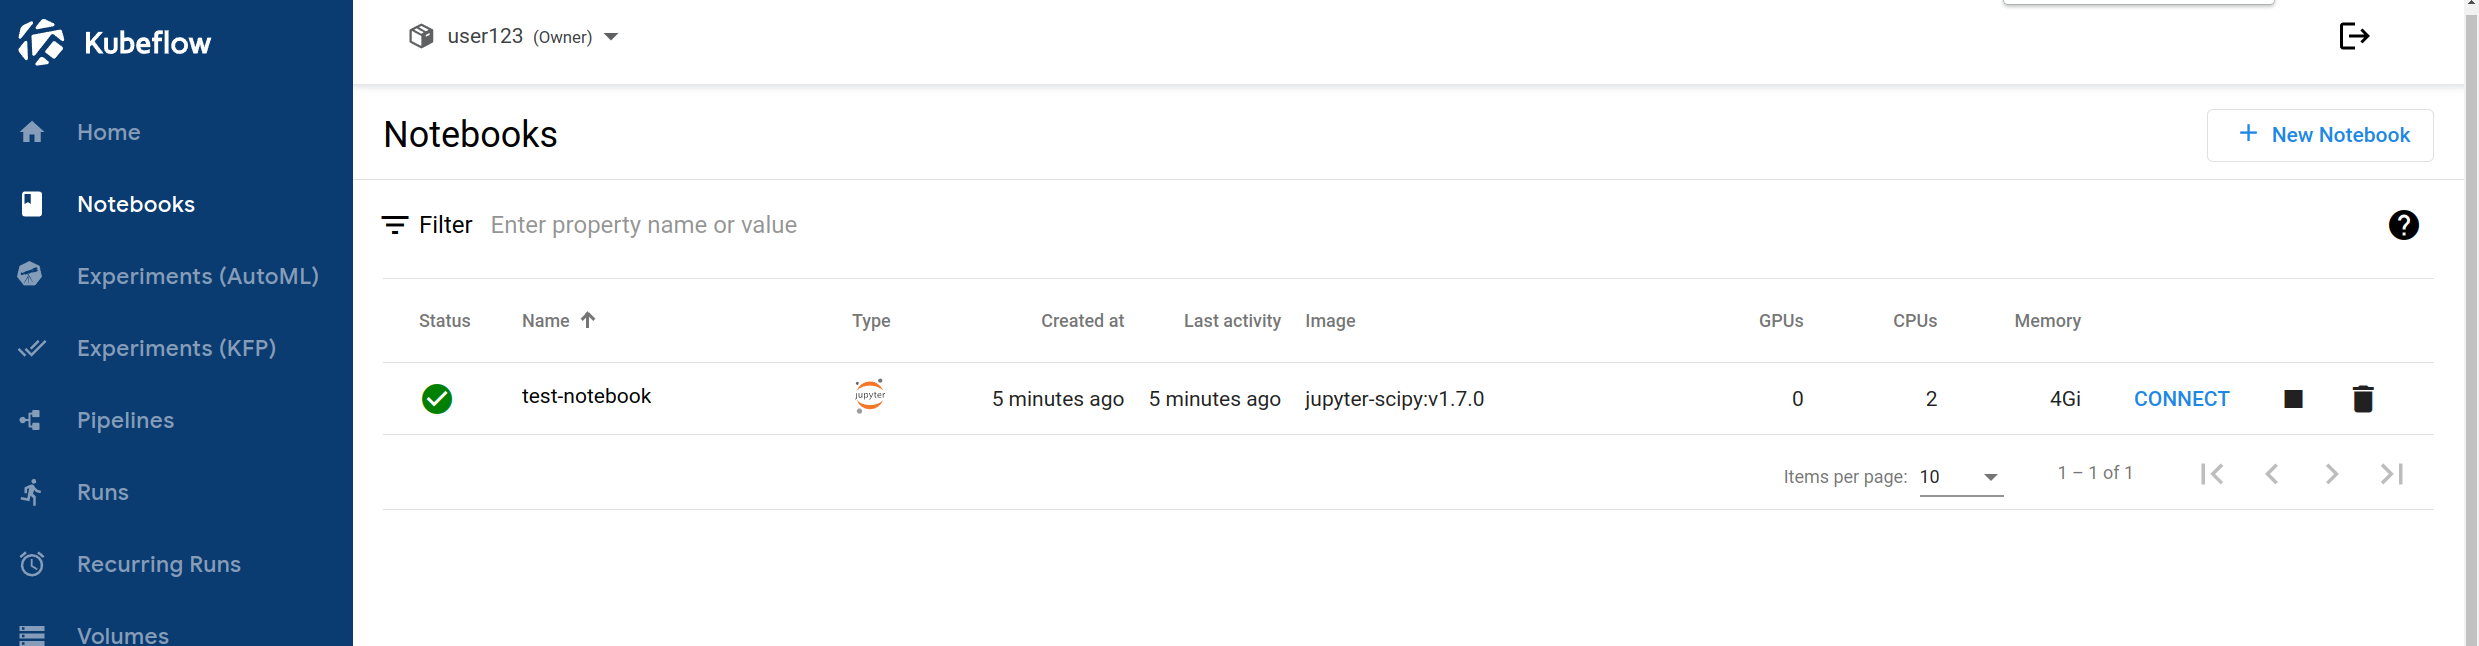
When you connect to the notebook server, you’ll be taken to the notebook environment in a new tab. Because of our earlier configurations, this environment is now connected to MLflow in the background. This means the notebooks we create here can access MLflow. Cool!
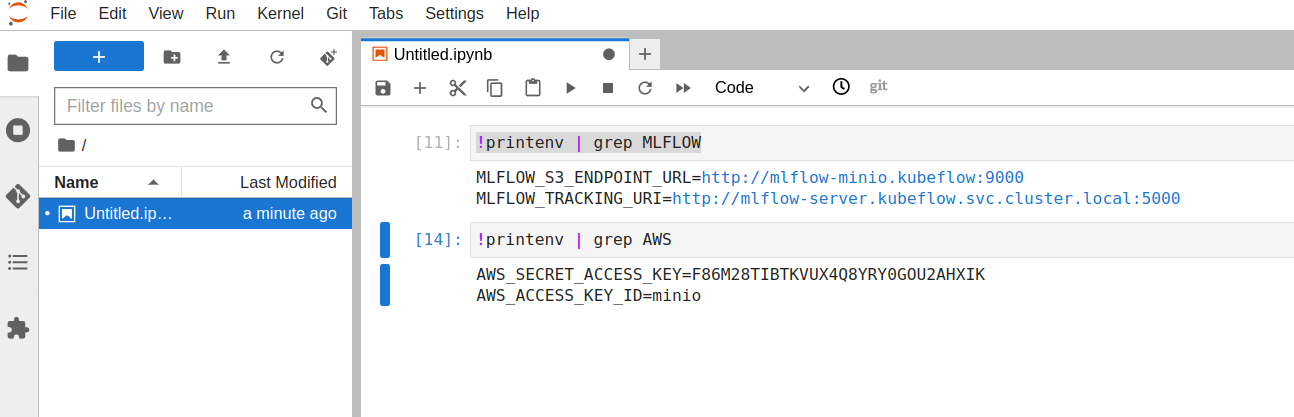
To test this, create a new notebook and paste the following command into it, in a cell:
!printenv | grep MLFLOW
Run the cell. This will print out two environment variables MLFLOW_S3_ENDPOINT_URL and MLFLOW_TRACKING_URI, confirming MLflow is indeed connected.
Great, we’ve launched a notebook server that’s connected to MLflow! Now let’s upload some example notebooks to this server to see MLflow in practice.
Run Mlflow examples
To run mlflow examples on your newly created notebook server click on the source control icon in the left most navigation bar.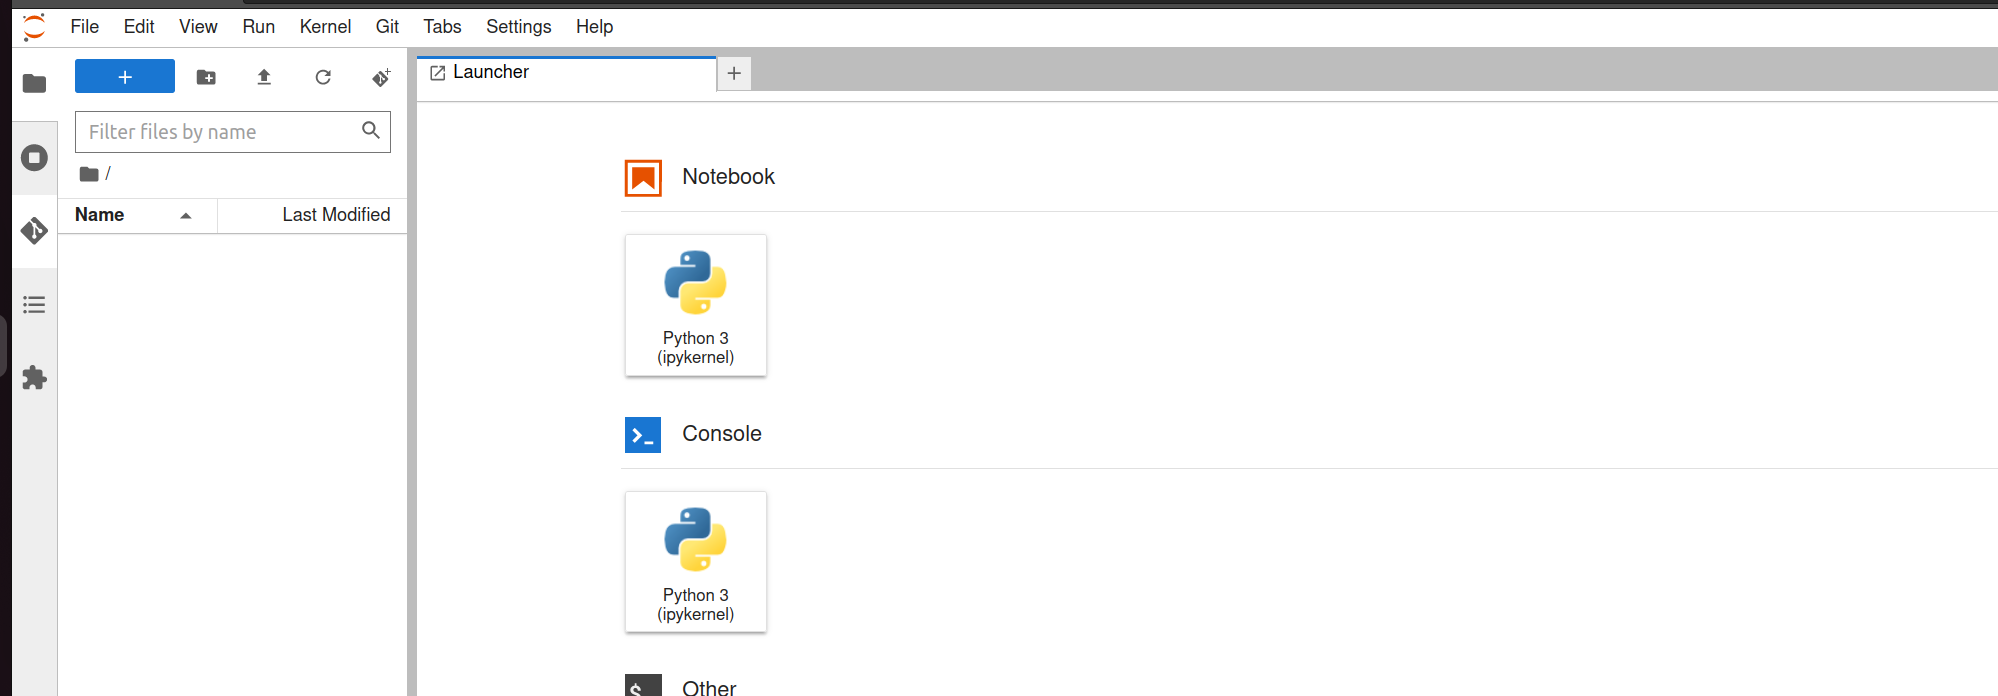
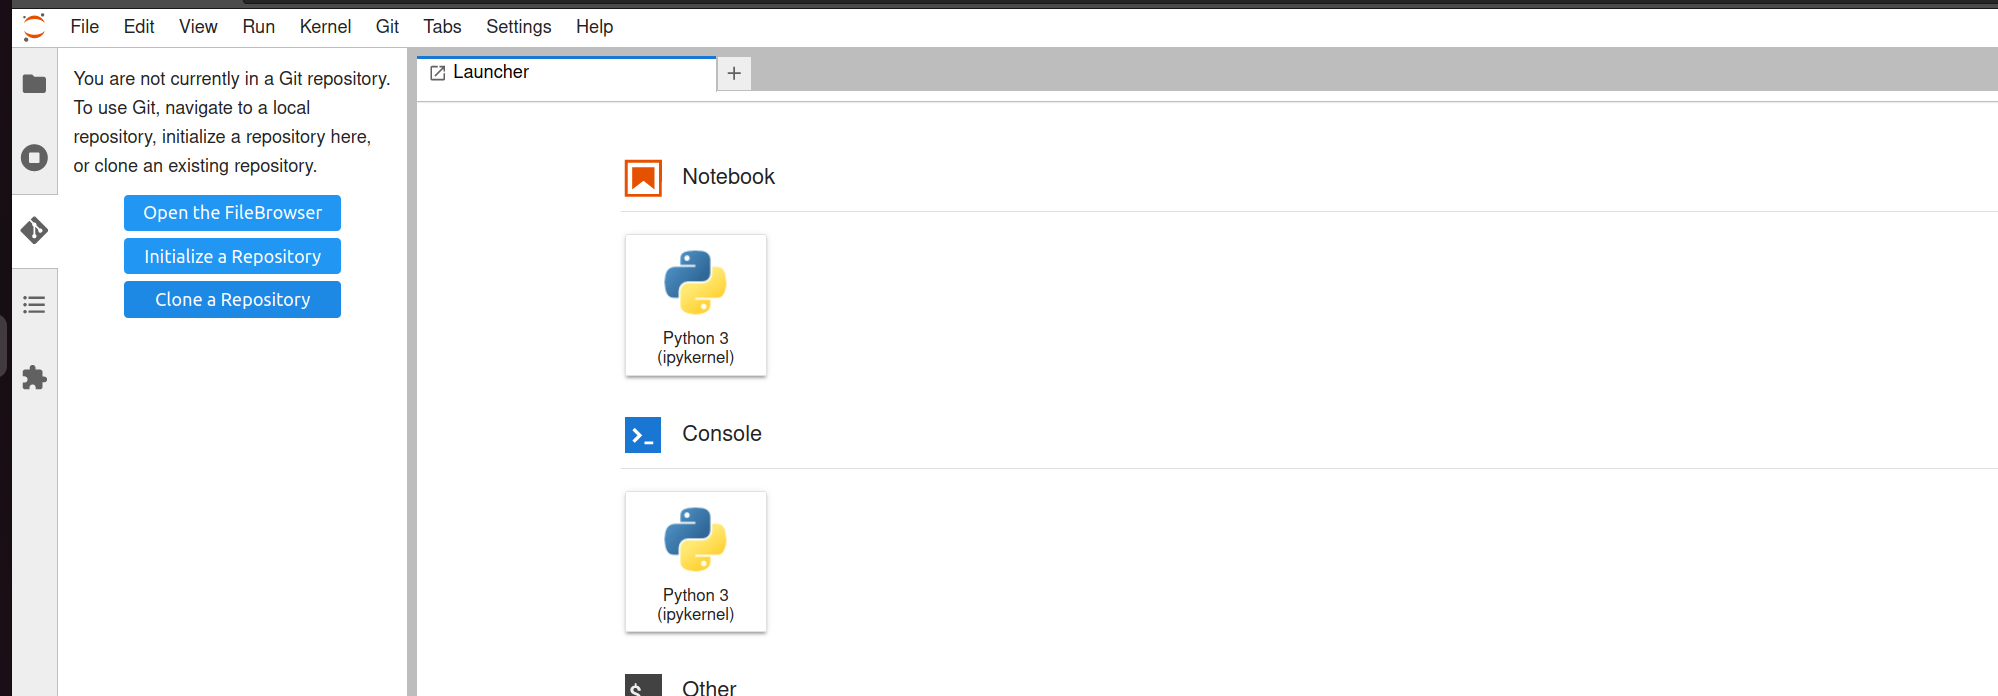
From the menu choose the Clone a Repository option.
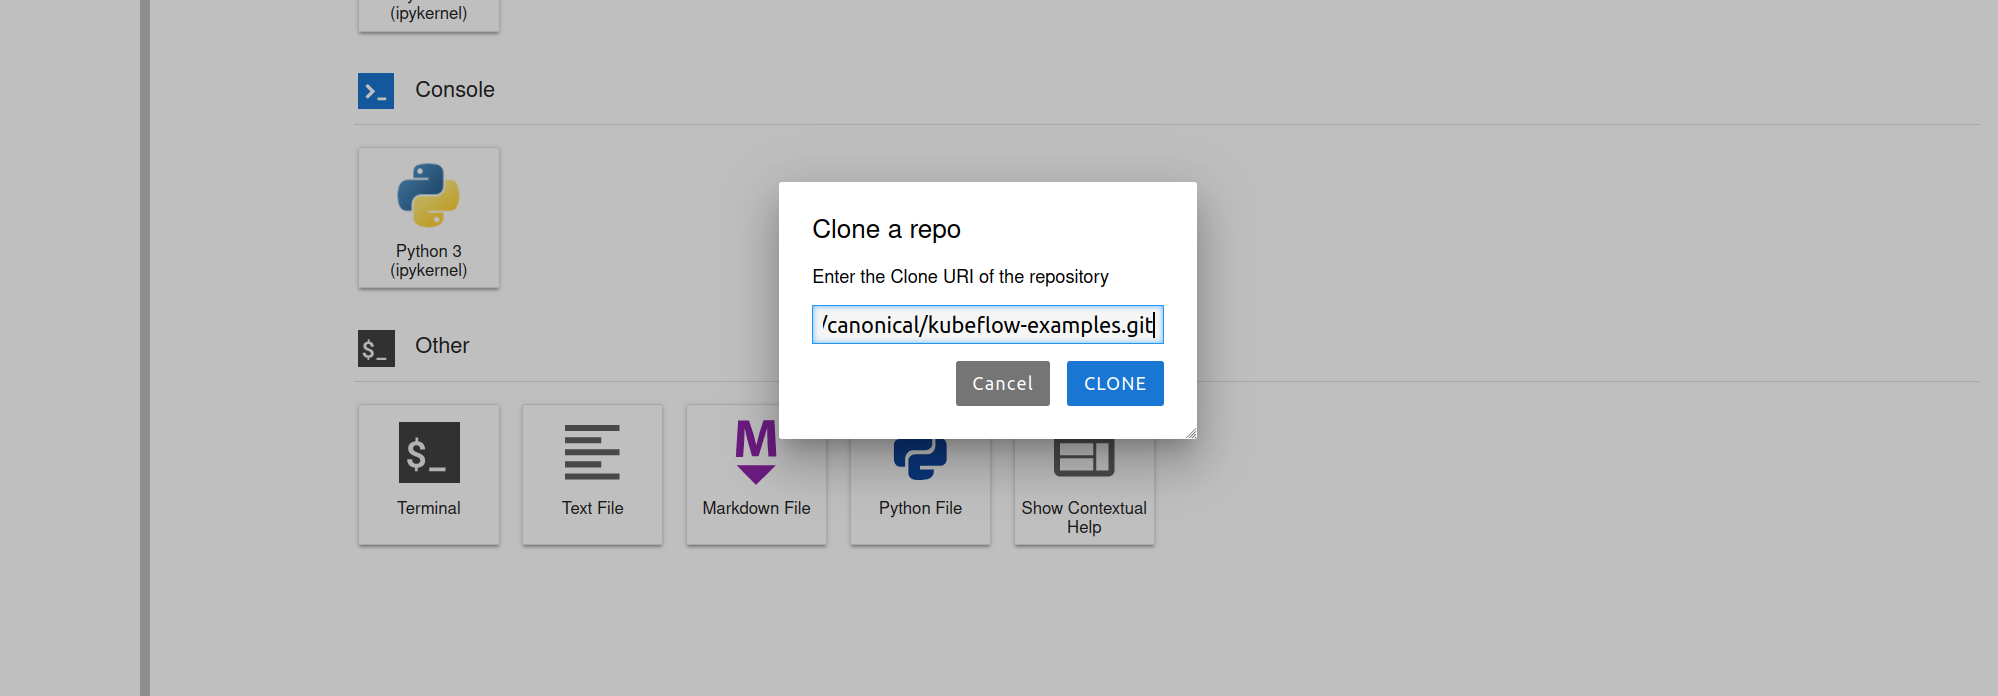
Now insert this repository address GitHub - canonical/kubeflow-examples: Charmed Kubeflow examples
This will clone a whole kubeflow-examples repository onto the notebook server. The cloned repository will be a folder on the server, with the same name as the remote repository. Go inside the folder and after that choose the mlflow-v2-examples subfolder.
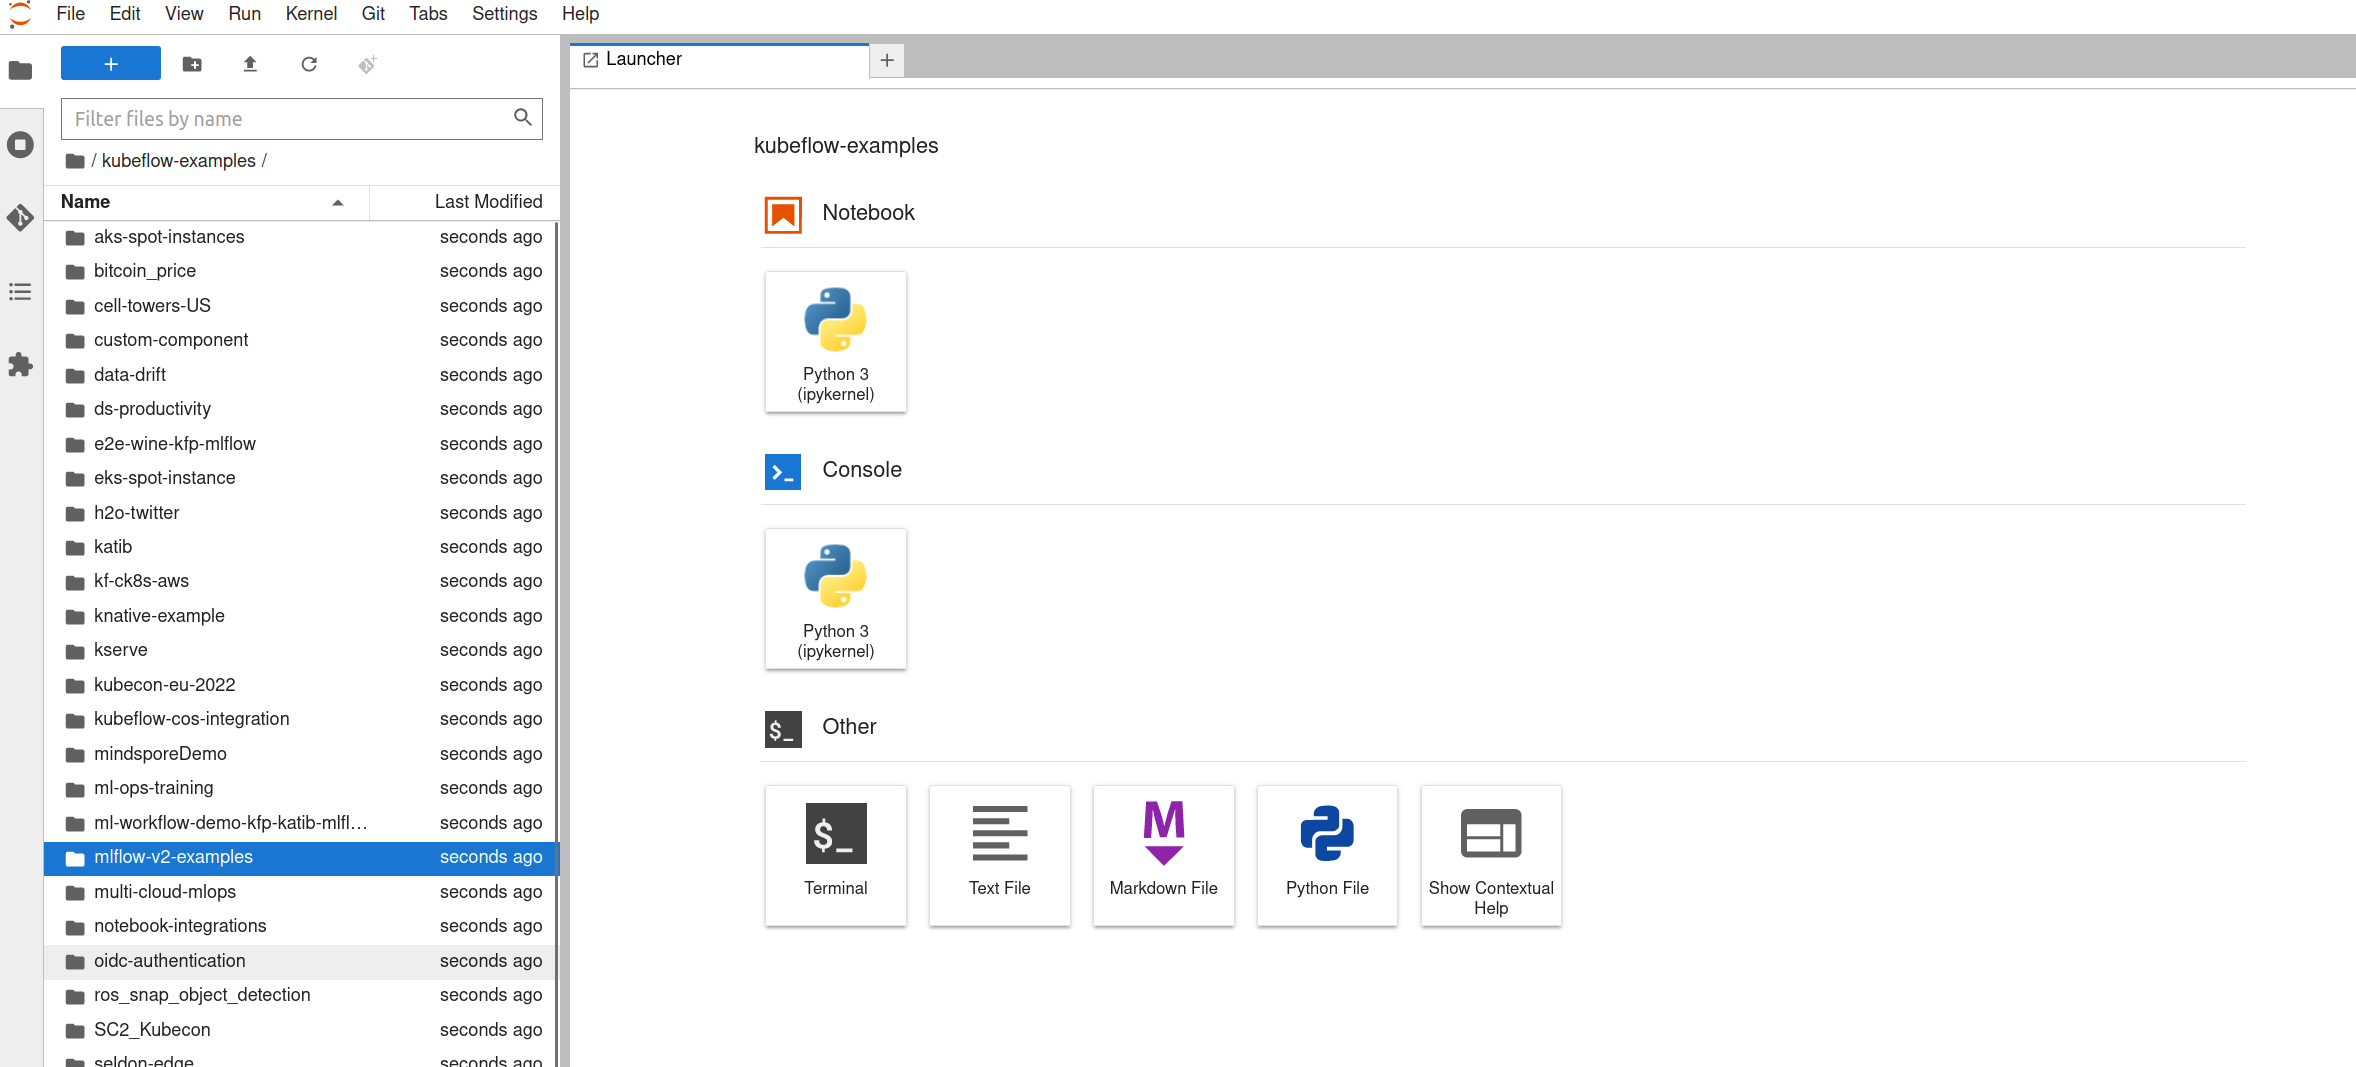
There you will find two notebooks:
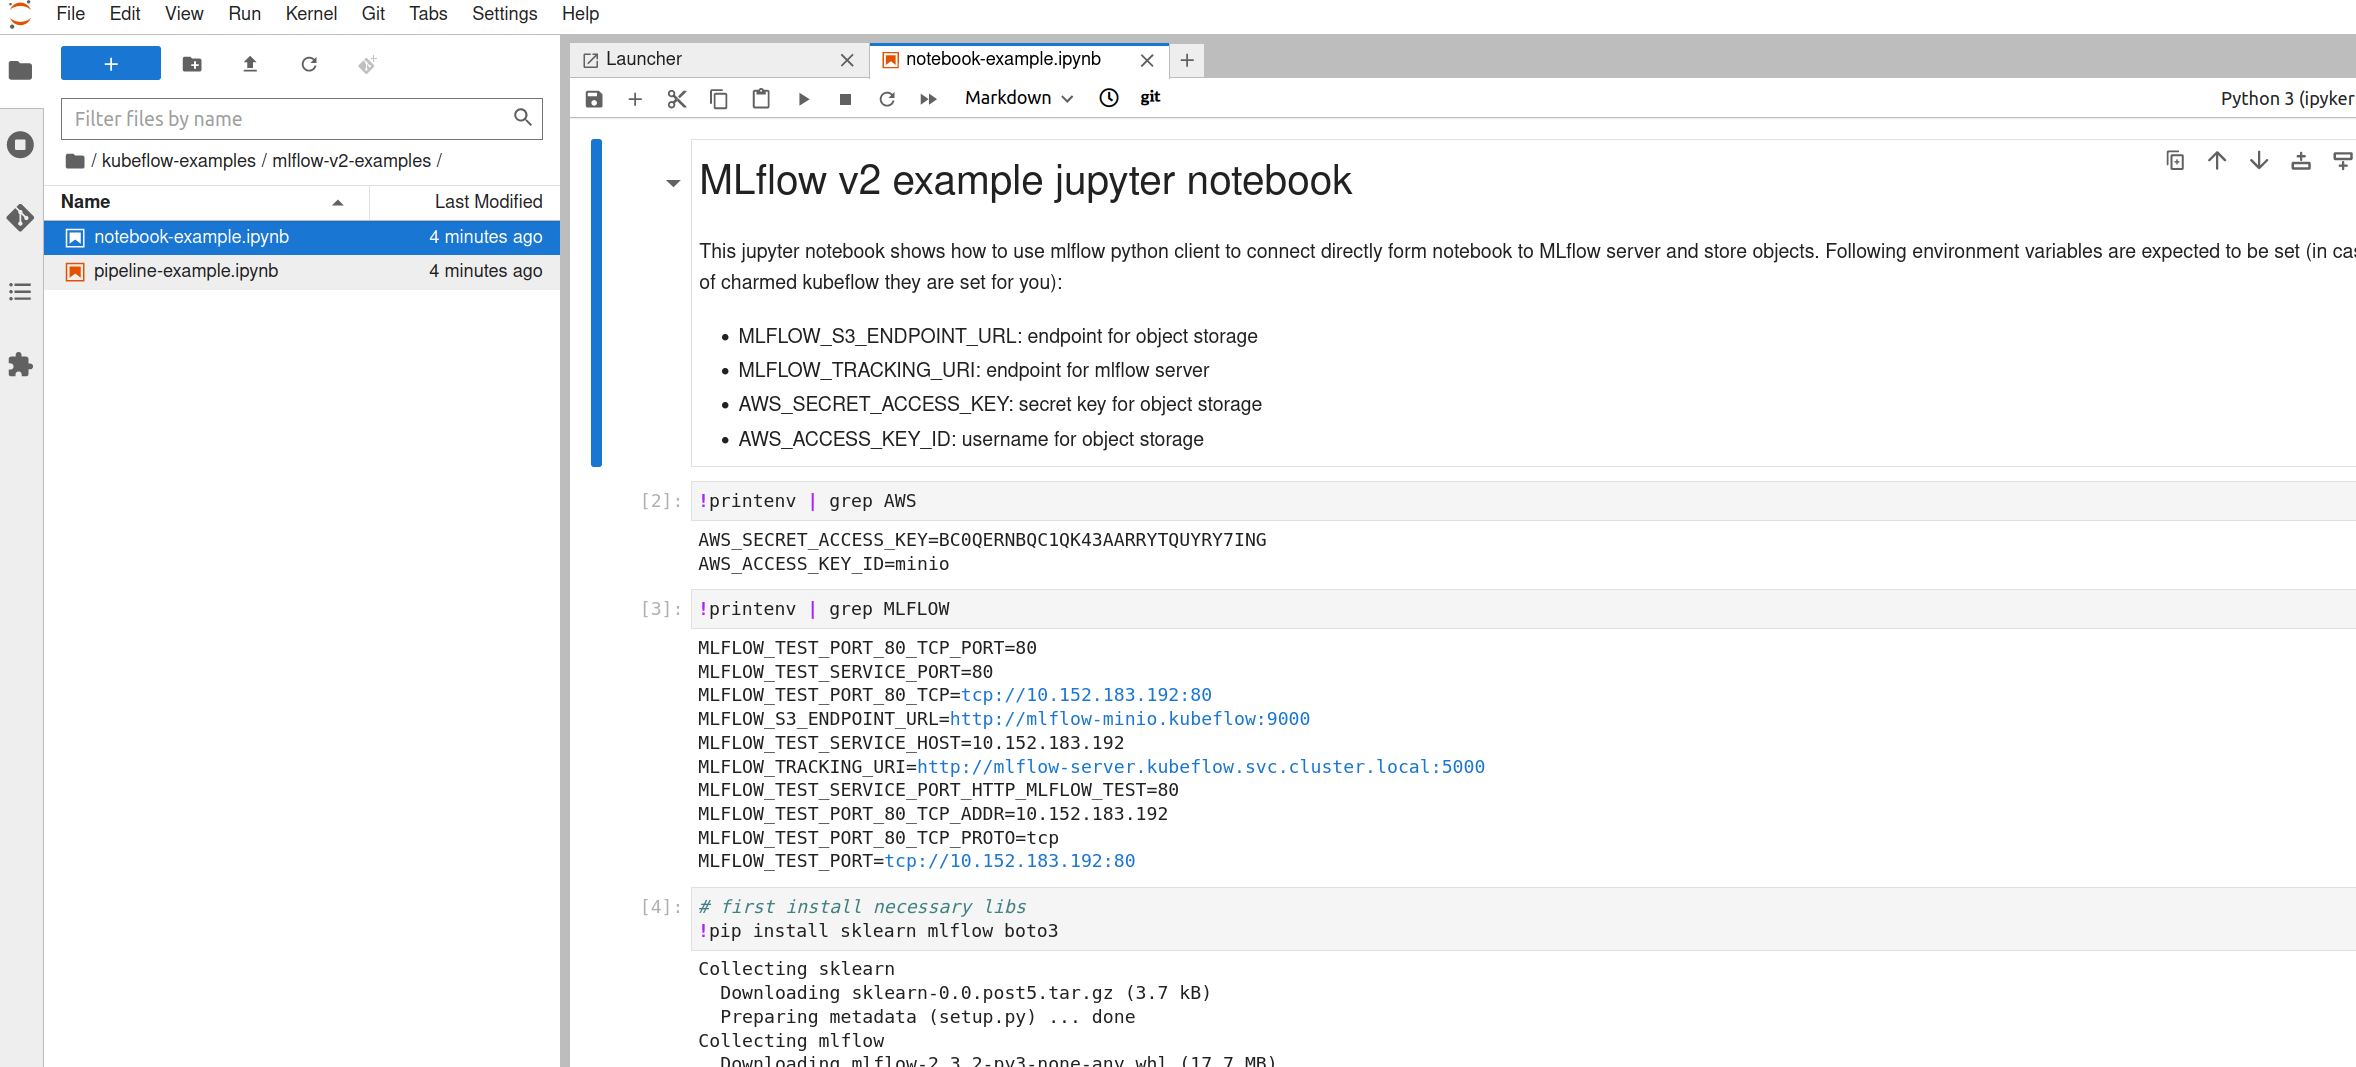
notebook-example.ipynb: demonstrates how to talk to MLflow from inside a notebook. The example uses a simple classifier which is stored in MLflow registry.pipeline-example.ipynb: demonstrates how to talk to MLflow from a Kubeflow pipeline. The example creates and executes a three step Kubeflow pipeline with the last step writing a model object to the MLflow registry.
Go ahead, try those notebooks out for yourseld! You can run them cell by cell using the run button, or all at once using the double chevron >>.
Note: if you get an error in the Notebooks related to
sklearn, try replacingsklearnwithscikit-learn. See here for more details.