First steps with Charmed OSM

Welcome to Charmed OSM osm-40

The objective of this page is to give an overview of the first steps to get started with Charmed OSM.

Requirements

  • OS: Ubuntu 18.04 LTS (Bionic) or Ubuntu 20.04 LTS (Focal)
  • MINIMUM:
    • 4 CPUs
    • 8 GB RAM
    • 50GB disk
    • Single interface with Internet access.
  • RECOMMENDED:
    • 8 CPUs
    • 16 GB RAM
    • 120GB disk
    • Single interface with Internet access.

User Guide

Installing OSM has never been easier. With one command, you will be able to deploy Charmed OSM in an empty environment using microk8s.

First of all, let’s download the installation script for upstream, and give it executable permissions.

wget https://osm-download.etsi.org/ftp/osm-11.0-eleven/install_osm.sh
chmod +x install_osm.sh

Install

To install Charmed OSM locally you should execute the following command:

./install_osm.sh --charmed

Checking the status

While the installer is running, you will see progress in the number of active services, which can take several minutes depending on the internet connection speed. While this is running, to see the status of the deployment execute watch -c juju status --color. Also, you can execute watch kubectl -n osm get pods to see the status of the Kubernetes Pods.

You will see this output from the juju status command when the deployment is finished.

$ juju status
Model  Controller  Cloud/Region        Version  SLA          Timestamp
osm    osm-vca     microk8s/localhost  2.9.17   unsupported  14:32:14+01:00

App          Version                         Status  Scale  Charm        Store       Channel  Rev  OS          Address         Message
grafana      ubuntu/grafana@8952155          active      1  grafana      charmstore  edge      10  kubernetes  10.152.183.111  
kafka        wurstmeister/kafka@968e579      active      1  kafka        charmstore  edge       1  kubernetes  10.152.183.203  
keystone     opensourcemano/keystone:11      active      1  keystone     charmstore  edge      16  kubernetes  10.152.183.103  
lcm          opensourcemano/lcm:11           active      1  lcm          charmstore  edge      15  kubernetes  10.152.183.211  
mariadb-k8s  mariadb/server:10.3             active      1  mariadb-k8s  charmstore  stable    35  kubernetes  10.152.183.246  
mon          opensourcemano/mon:11           active      1  mon          charmstore  edge      12  kubernetes  10.152.183.249  
mongodb      library/mongo@11b4907           active      1  mongodb-k8s  charmhub    stable     1  kubernetes  10.152.183.122  
nbi          opensourcemano/nbi:11           active      1  nbi          charmstore  edge      18  kubernetes  10.152.183.217  
ng-ui        opensourcemano/ng-ui:11         active      1  ng-ui        charmstore  edge      25  kubernetes  10.152.183.108  
pla          opensourcemano/pla:11           active      1  pla          charmstore  edge      13  kubernetes  10.152.183.83   
pol          opensourcemano/pol:11           active      1  pol          charmstore  edge      10  kubernetes  10.152.183.181  
prometheus   .../prometheus-backup@f3ddf1f   active      1  prometheus   charmstore  edge       9  kubernetes  10.152.183.53   
ro           opensourcemano/ro:11            active      1  ro           charmstore  edge      10  kubernetes  10.152.183.84   
zookeeper    .../kubernetes-zookeeper@35...  active      1  zookeeper    charmstore  edge       1  kubernetes  10.152.183.235  

Unit            Workload  Agent  Address       Ports                       Message
grafana/0*      active    idle   10.1.245.122  3000/TCP                    ready
kafka/0*        active    idle   10.1.245.115  9092/TCP                    ready
keystone/0*     active    idle   10.1.245.119  5000/TCP                    ready
lcm/0*          active    idle   10.1.245.86   9999/TCP                    ready
mariadb-k8s/0*  active    idle   10.1.245.107  3306/TCP                    ready
mon/1*          active    idle   10.1.245.83   8000/TCP                    ready
mongodb/0*      active    idle   10.1.245.124  27017/TCP                   
nbi/0*          active    idle   10.1.245.105  9999/TCP                    ready
ng-ui/0*        active    idle   10.1.245.98   80/TCP                      ready
pla/0*          active    idle   10.1.245.75   9999/TCP                    ready
pol/0*          active    idle   10.1.245.68   9999/TCP                    ready
prometheus/0*   active    idle   10.1.245.79   9090/TCP                    ready
ro/0*           active    idle   10.1.245.104  9090/TCP                    ready
zookeeper/0*    active    idle   10.1.245.84   2181/TCP,2888/TCP,3888/TCP  ready

Known issues

None.

Start playing with OSM

If you have installed OSM in an external machine, or in a VM, you can access it through the kubernetes ingress controller enabled in microk8s. These are the services exposed:

  • OSM UI: https://ui.<ip>.nip.io
  • NBI: https://nbi.<ip>.nip.io
  • Prometheus: https://prometheus.<ip>.nip.io
  • Grafana: https://grafana.<ip>.nip.io

Note: <ip> should be replaced by the IP of the default network interface in your OSM Machine

OSM User Interface

Access from outside the machine at http://ui.<ip>.nip.io, or at http://10.152.183.108 (see ng-ui cluster IP in juju status) from inside the OSM Machine.

  • Username: admin
  • Password: admin

OSM Client

The OSM client is automatically installed with Charmed OSM, but if you want to install it in a separate machine, you can easily do that installing the osmclient snap:

sudo snap install osmclient --channel 11.0/stable

The OSM client needs the OSM_HOSTNAME environment variable pointing to the NBI.

export OSM_HOSTNAME=nbi.<ip>.nip.io:443
osm --help  # print all the commands

Prometheus

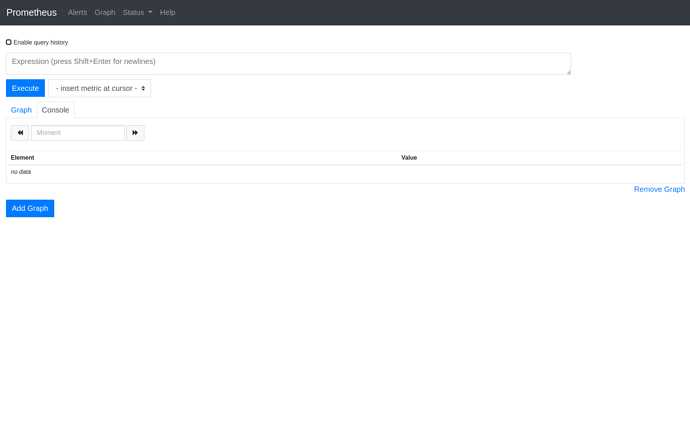
Access Prometheus User Interface from outside the machine at http://prometheus.<ip>.nip.io, or at http://10.152.183.53:9090 (see prometheus cluster IP in juju status) from inside the OSM Machine.

  • Username: admin
  • Password: admin

Grafana

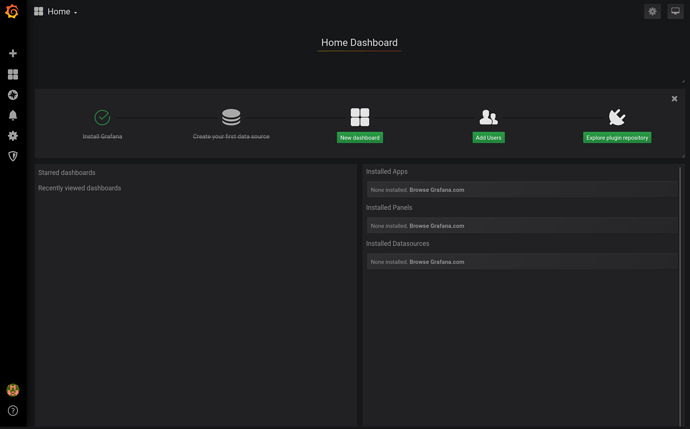
Access Grafana User Interface from outside the machine at http://grafana.<ip>.nip.io, or at http://10.152.183.111:3000 (see grafana cluster IP in juju status) from inside the OSM Machine.

  • Username: admin
  • Password: Execute this command to get the password: juju run --unit grafana/0 -- "echo \$GF_SECURITY_ADMIN_PASSWORD".

Uninstall

To uninstall Charmed OSM you should execute the following command.

juju kill-controller osm-vca -y -t0

Note: this will not remove microk8s or juju even if they were installed by the installer. Removal of these components can be done manually once it is known that no other services require them with the following commands:

sudo snap remove --purge juju
sudo snap remove --purge microk8s

Troubleshooting

If you have any trouble with the installation, please contact us, we will be glad to answer your questions:

5 Likes

In environments with restricted network access, you may encounter an error similar to this:

ERROR cannot deploy bundle: cannot add charm "cs:~charmed-osm/grafana-k8s-13": cannot retrieve charm "cs:~charmed-osm/grafana-k8s-13": cannot get archive: Get https://api.jujucharms.com/charmstore/v5/~charmed-osm/grafana-k8s-13/archive?channel=edge: dial tcp: lookup api.jujucharms.com on 10.152.183.10:53: read udp 10.1.1.12:55949->10.152.183.10:53: i/o timeout

In order to solve this, we need to edit the kube-dns configuration to point to your DNS servers. Edit the configuration and both sets of DNS addresses accordingly:

microk8s.kubectl -n kube-system edit configmap/kube-dns

kube-dns will automatically reload the configuration, so re-run juju deploy command and verify that the error is resolved.

Get the name of the kube-dns pod:

$ kubectl -n kube-system get pods
NAME                                              READY   STATUS    RESTARTS   AGE
heapster-v1.5.2-6b5d7b57f9-c9vln                  4/4     Running   0          67m
hostpath-provisioner-6d744c4f7c-cr9br             1/1     Running   0          71m
kube-dns-6bfbdd666c-xrnnb                         3/3     Running   3          71m
kubernetes-dashboard-6fd7f9c494-zx6s9             1/1     Running   0          71m
monitoring-influxdb-grafana-v4-78777c64c8-lsh8l   2/2     Running   2          71m

Check the logs for dnsmasq container in the pod:

$ kubectl -n kube-system logs kube-dns-6bfbdd666c-xrnnb dnsmasq

Once dnsmasq is able to resolve hostnames, you can continue with the installation.

hello,

Thanks for the info
 but can you please elaborate a bit on the needed changes? E.g. do we edit the upstreamNameservers only or also the kubectl.kubernetes.io/last-applied-configuration? What are the correct values? how should we get them? E.g. I tries an nslookup and got the addresses from there to put on the DNS config
 saved and exited
 but didn’t work. I still have same error.

Can you please mention a bit more detailed how to fix this error? Thank you and sorry
 forgot to mention
 newbie alert :slight_smile:

hello again,
Whatever attempt I did with editing that file didn’t work.

I managed to solve this with:
sudo iptables -P FORWARD ACCEPT
(ubuntu 18.04 fresh install on a VM)

After exposing the services, I am receiving a Disallowed Host error from Django. Is there a juju or kubernetes configuration settings to allow access from the host of the VM host? I am using multipass to run ubuntu 18.04 and the OSM environment.

Found the local_settings.py override file: /var/snap/microstack/common/etc/horizon/local_settings.d/_05_snap_tweaks.py

Reference article: https://opendev.org/x/microstack/commit/3230120f6201a13b00a9c9c479571bfbc3949cee

Excellent. Does this mean that your problem is solved?

Yes and no. I have been trying to follow the Canonical tutorial here. As I wrote above, I am installing on a multipass VM and want to access the GUI from my laptop. Following this article, enabling ingress and exposing the services, the snap install of microstack --classic --beta installed a local_settings.py with ALLOWED_HOSTS set to internal VM addresses; overriding using the local_settings.d file worked. But I found that enabling the ingress module causes nginx.service to no longer restart. I rebuilt a brand new VM today and install microstack --classic --edge and the ALLOWED_HOSTS setting has been updated to *.

Yes, I can access the Web Gui at osm..xip.io. However, this is showing me the openstack web page not the OSM web page that I have seen in the ETSI OSM presentation videos. Also, after the exposing osm/prometheus/grafana services per the article, all addresses are resolving to the same openstack gui rather than 3 different services.

The instructions to expose the services above are identical to several other references, so should I be expecting the OSM Web UI or the Openstack Web UI? If the former, do you have any pointers how to properly expose it?

Hello @aahamlin!

You’re having that issue basically because ingress and the microstack dashboard are using basically the same port.

I’m going to find out the way of changing the microstack dashboard port, and will come back to you.

In the meantime, you can disable ingress, and use sshuttle to access the OSM services.

sshuttle -r ubuntu@<ip> -N -v
# Access the IPs of the services shown by the `juju status` command

Regarding the ALLOWED_HOSTS, I’m going to find out the way to add an IP to that, but in the meantime you can map it to your localhost by using the -L flag:

ssh ubuntu@<ip> -L 8080:localhost:80

Thanks @davigar15

Your reply confirms my deduction of the issue. Thanks for suggestions, I will give them a try tomorrow. If you do find a way to alter the microstack dashboard port that would be appreciated, if I figure it out I’ll post back.

This is the first time I have used multipass. I had hoped the tutorial would provide a simple way to get all the way to a running OSM installation, including accessing the web gui. :slight_smile:

The edge release of microstack (or the use of the local_setting.d directory overrides) have gotten me past the ALLOWED_HOSTS issue for the moment.

Hello @aahamlin,

I have spoken with the main developer of microstack, and we sort out a list of steps that should solve the issue you’re having. When installing microstack, do this:

sudo snap install microstack --edge --classic
sudo snap set microstack config.network.ports=8080
sudo snap set microstack config.network.dashboard-allowed-hosts=*
sudo microstack.init --auto

Then try to access the openstack dashboard at http://<VM_IP>:8080
That should also unblock you from not being able to use the microk8s ingress, since the openstack dashboard will be running in another port.

PS: I will test those steps, but if you’re able to test it before me, please make sure you ping me how did it go.

Thanks!
Ping me if you need anything.

2 Likes

Hello!
I don’t see the setup_lxd.sh file. Can anyone please help to point me where I can find it?
Thanks!

Like Alex righty asked I can’t find the following files in the git repo:

setup_lxd.sh
install_nfs.sh
vca_config.sh

Also how can deploy this using a generic k8s cluster (i.e. if I don’t want to use microk8s)?

Those of you who ran into issues might want to check out the current set of instructions which have been updated by @davigar15, thanks David!

2 Likes

Hello,
I have been trying to follow this tutorial steps (OSM Development Stack). When I run: osmclient.overlay, I get this error: osmclient.overlay: command not found. So, I’ve decided to follow the official docs installation for OSM charmed (https://osm.etsi.org/docs/user-guide/03-installing-osm.html#charmed-installation). When I run: ./install_osm.sh --charmed, I get this error that I can’t solve:permanently dropping privs did not work: File exists
permanently dropping privs did not work: File exists
Microk8s storage failed to enable
permanently dropping privs did not work: File exists
I can’t find anything that works and I am in a dead end.
Can you please help me?

Thank you for your time

Hello @zalos56,

First of all, sorry for the late response. We’re now in the OSM Hackfest 10 and that got us distracted these days. Apologies, and I will help you out.

Regarding the osmclient.overlay command not found error, that is because that command no longer exists, but the installer script you executed is tested everyday, so let’s find out what’s going on :slight_smile:

Could you please let me know the specs of the VM/Machine in which you’re installing OSM? Could you also share the output of the microk8s.inspect command? (And the tarball generated)

1 Like

Hi @davigar15,
I had the exact same issue “Microk8s storage failed to enable
permanently dropping privs did not work: File exists”

I create a new VM with Ubuntu VERSION=“18.04.5 LTS (Bionic Beaver)” with the recommended resources setup, and executed the ‘./install_osm.sh --charmed’

Here goes the output and the inspect tar

      Service snap.microk8s.daemon-cluster-agent is running
      Service snap.microk8s.daemon-containerd is running
      Service snap.microk8s.daemon-apiserver is running
      Service snap.microk8s.daemon-apiserver-kicker is running
      Service snap.microk8s.daemon-control-plane-kicker is running
      Service snap.microk8s.daemon-proxy is running
      Service snap.microk8s.daemon-kubelet is running
      Service snap.microk8s.daemon-scheduler is running
      Service snap.microk8s.daemon-controller-manager is running
      Copy service arguments to the final report tarball
    Inspecting AppArmor configuration
    Gathering system information
      Copy processes list to the final report tarball
      Copy snap list to the final report tarball
      Copy VM name (or none) to the final report tarball
      Copy disk usage information to the final report tarball
      Copy memory usage information to the final report tarball
      Copy server uptime to the final report tarball
      Copy current linux distribution to the final report tarball
      Copy openSSL information to the final report tarball
      Copy network configuration to the final report tarball
    Inspecting kubernetes cluster
      Inspect kubernetes cluster
    Inspecting juju
      Inspect Juju
    Inspecting kubeflow
      Inspect Kubeflow

inspection-report-20210111_161018.tar.gz

Thanks!

Hello @joaocoucelo! I’ve been looking at tar you attached, and I cannot see what’s the issue. You have enough memory and disk, and I’m not seeing anything obvious.

@kos.tsakalozos Could you please take a look at the inspection report? I heard more than once the issue about “Microk8s storage failed to enable dropping privs did not work: File exists”; but cannot find the root cause of it.

@joaocoucelo the cluster looks healthy to me. It has pods scheduled and running. What happens if you run microk8s enable dns storage?

@davigar15 where can I find the source code that sets up MicroK8s?

Hi @kos.tsakalozos and @davigar15,

I was only able to repeat the installation now, and I no longer have that issue. Don’t know if I did something wrong during the last install, or if there was some change in the meanwhile. Anyway, I can see now the microk8s cluster running and the ‘juju status’ showing all all Apps and Units active, exposing the expected ports.

I did the suggesting config in Juju | The simplest way to deploy and maintain applications in the cloud, and I’m able to use osmclient.osm CLI locally.
However I’m not able to access any of the exposed services externally.

I can see the following ports exposed by ingress

$ microk8s kubectl describe ingress
grafana.192.168.55.2.xip.io
prometheus.192.168.55.2.xip.io
nbi.192.168.55.2.xip.io
ui.192.168.55.2.xip.io
osm.192.168.55.2.xip.io

I can reach these links from outside, but I get “404 Not Found” for all of them.

For instance, for the OSM Web GUI (ng-ui), all appears to be up and running, but the service is not replying.

$ microk8s kubectl describe ingress
Name: ng-ui
Namespace: osm
Address:
Default backend: default-http-backend:80 (<error: endpoints “default-http-backend” not found>)
Rules:
Host Path Backends


ui.192.168.55.2.xip.io
/ ng-ui:80 (10.1.120.246:80)
Annotations: ingress.kubernetes.io/rewrite-target:
ingress.kubernetes.io/ssl-passthrough: false
ingress.kubernetes.io/ssl-redirect: false
kubernetes.io/ingress.allow-http: false
kubernetes.io/ingress.class: nginx
nginx.ingress.kubernetes.io/proxy-body-size: 0
Events:

$ juju status | grep ng-ui
ng-ui active 1 ng-ui jujucharms 9 kubernetes 10.152.183.119 exposed
ng-ui/0* active idle 10.1.120.246 80/TCP ready

$ microk8s kubectl get all | grep ng-ui
pod/ng-ui-operator-0 1/1 Running 0 4h37m
pod/ng-ui-6d9c8ddd9c-sf6zm 1/1 Running 0 4h32m
service/ng-ui-operator ClusterIP 10.152.183.125 30666/TCP 4h37m
service/ng-ui ClusterIP 10.152.183.119 80/TCP 4h32m
deployment.apps/ng-ui 1/1 1 1 4h32m
replicaset.apps/ng-ui-6d9c8ddd9c 1 1 1 4h32m
statefulset.apps/ng-ui-operator 1/1 4h37m

$ netstat -an | grep 10.1.120.246
tcp 0 0 192.168.55.2:51494 10.1.120.246:80 TIME_WAIT
tcp 0 0 192.168.55.2:51204 10.1.120.246:80 TIME_WAIT
tcp 0 0 192.168.55.2:51200 10.1.120.246:80 TIME_WAIT


Any idea what I may be missing, or how can I troubleshoot further this issue?

2 Likes