
After the previous charmcraft pack performance analysis and related fixes, I decided that we should formalize the measurement of how/where the time is spent in that command.
I started a few days ago to instrument the code, with a couple of helpers that I’m still developing.
After all is implemented the measurement will be dumped to a file if the --measure=FILENAME option is used. This file will be the source of two performance analysis tools.
The first one will be a time series showing how packing specific charms behave across time following all changes in the code. This way we will be able to see how performance is improved over time (or at least ensure that there is no performance degradation).
The second one is to visualize specific runs, with the objective of understanding where we could improve the overall process. It will be a manual tool (so far not included in the Charmcraft snap but availale in the source code). Here I leave some examples of graphs that this visualization tool will generate (actually, the tool opens an interactive window that let you zoom, span, etc).
This is the overall run for a simple charm after a clean was run:
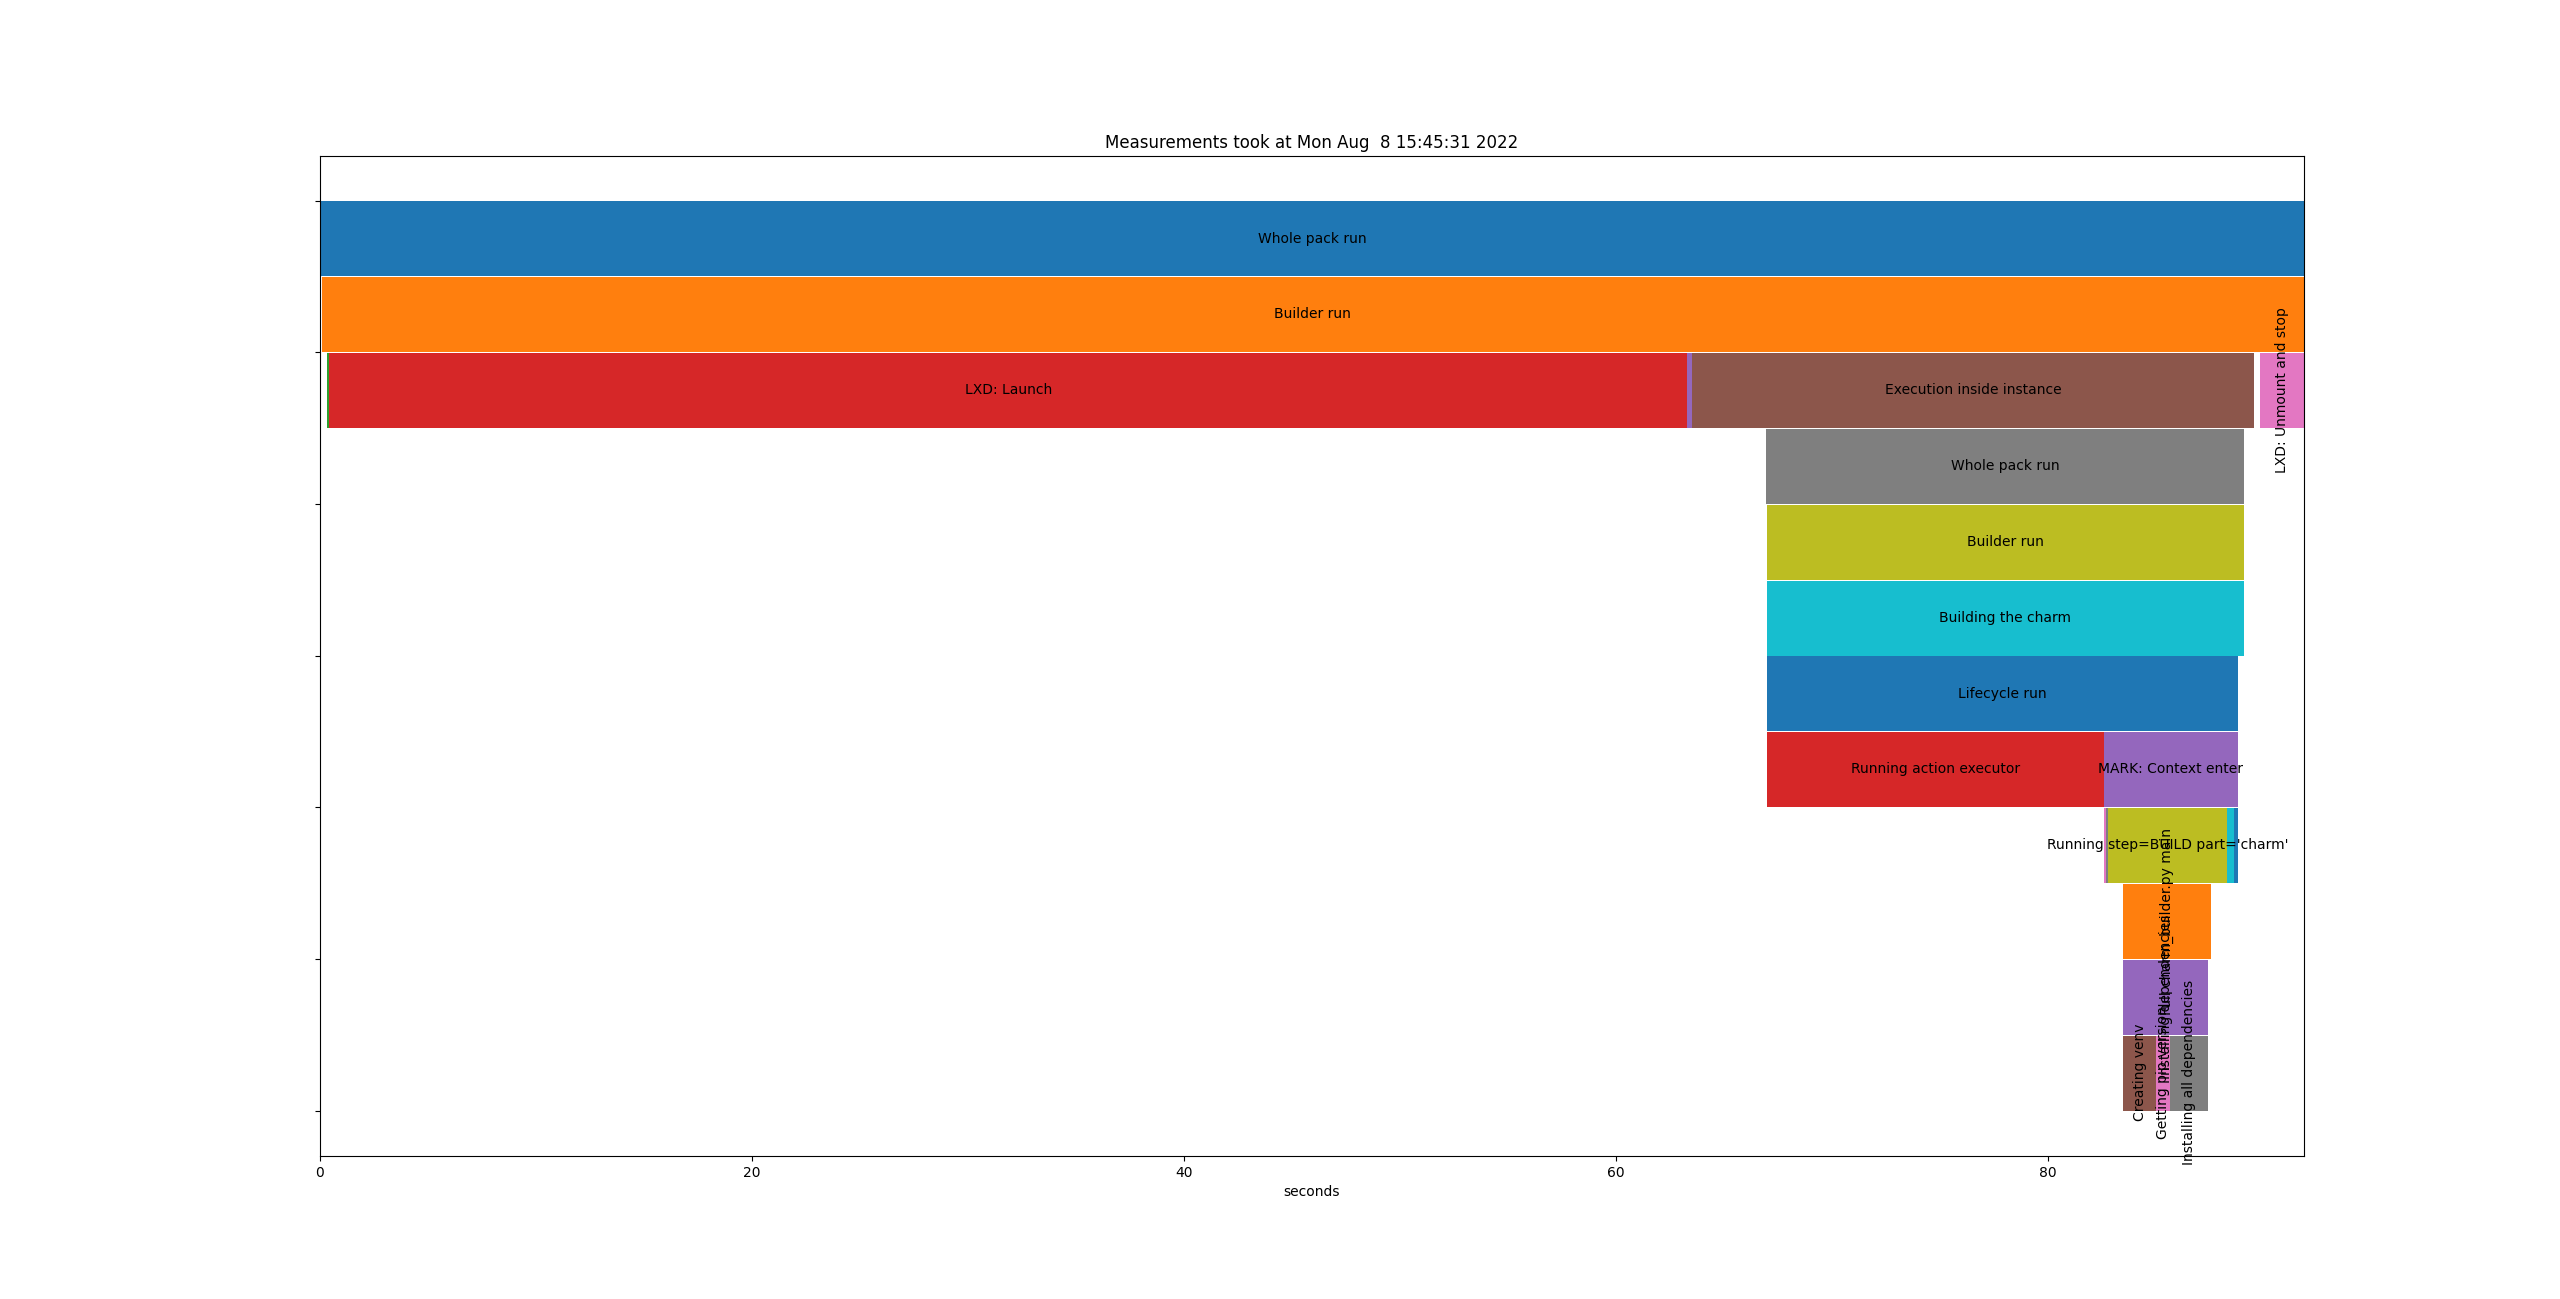
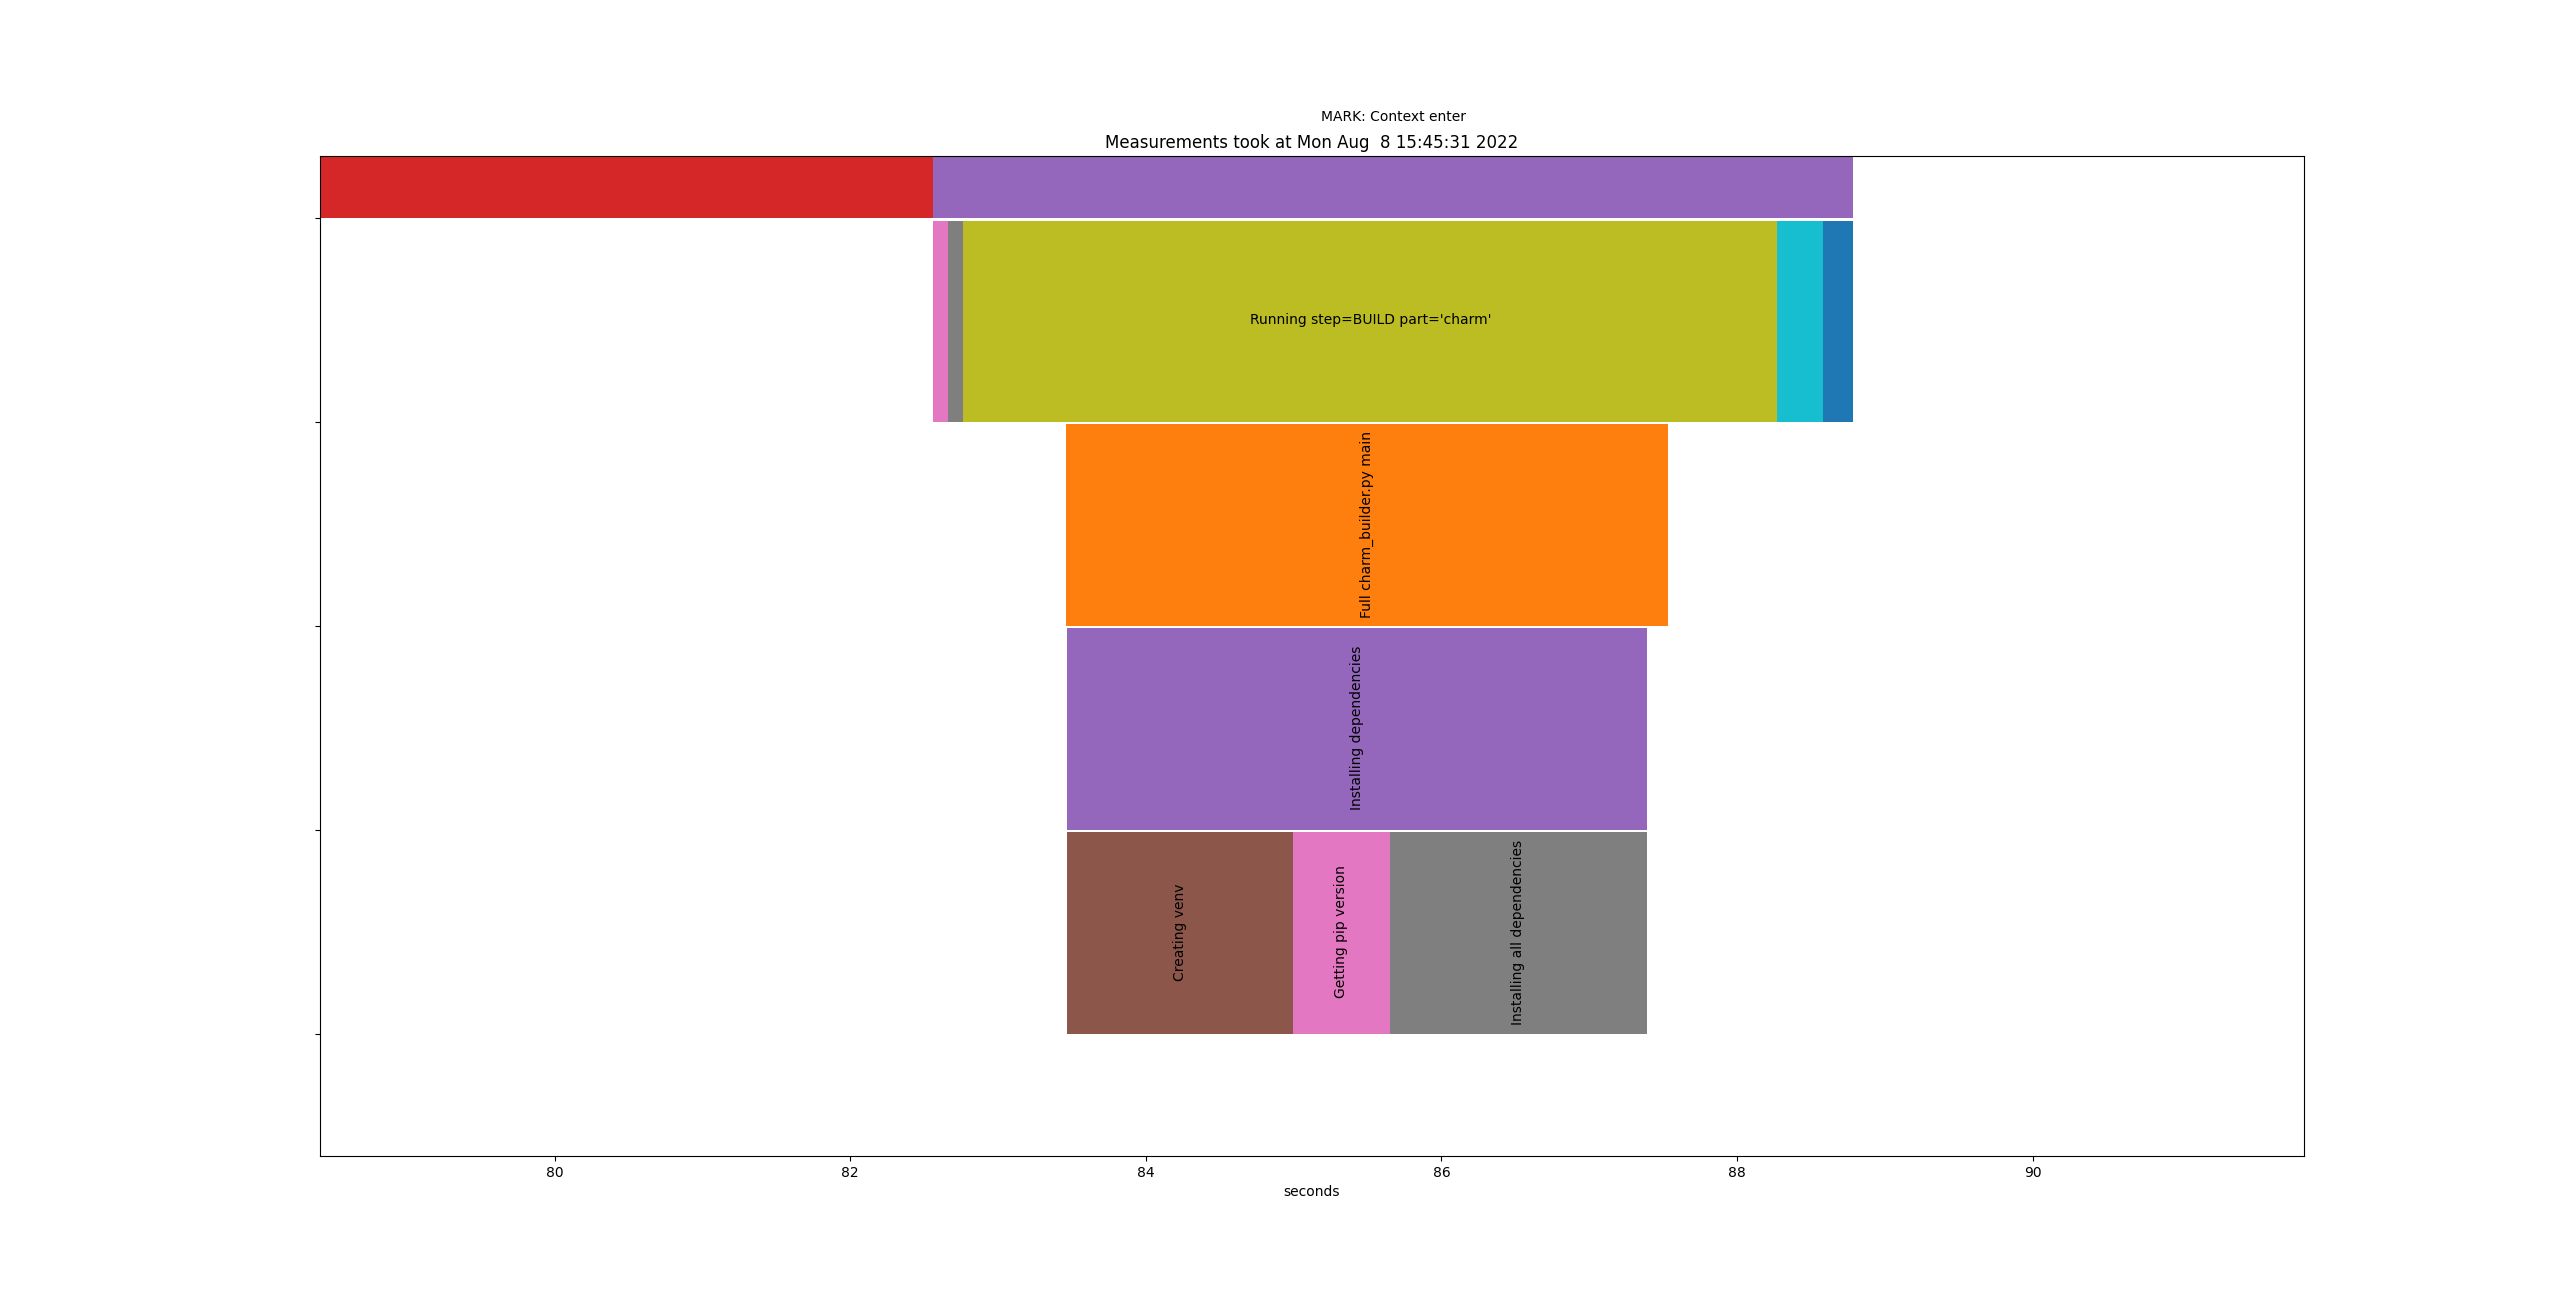
As it’s expected, a lot of time is gone while setting up the instance. This is a zoom of the previous graph, highlighting the BUILD step:
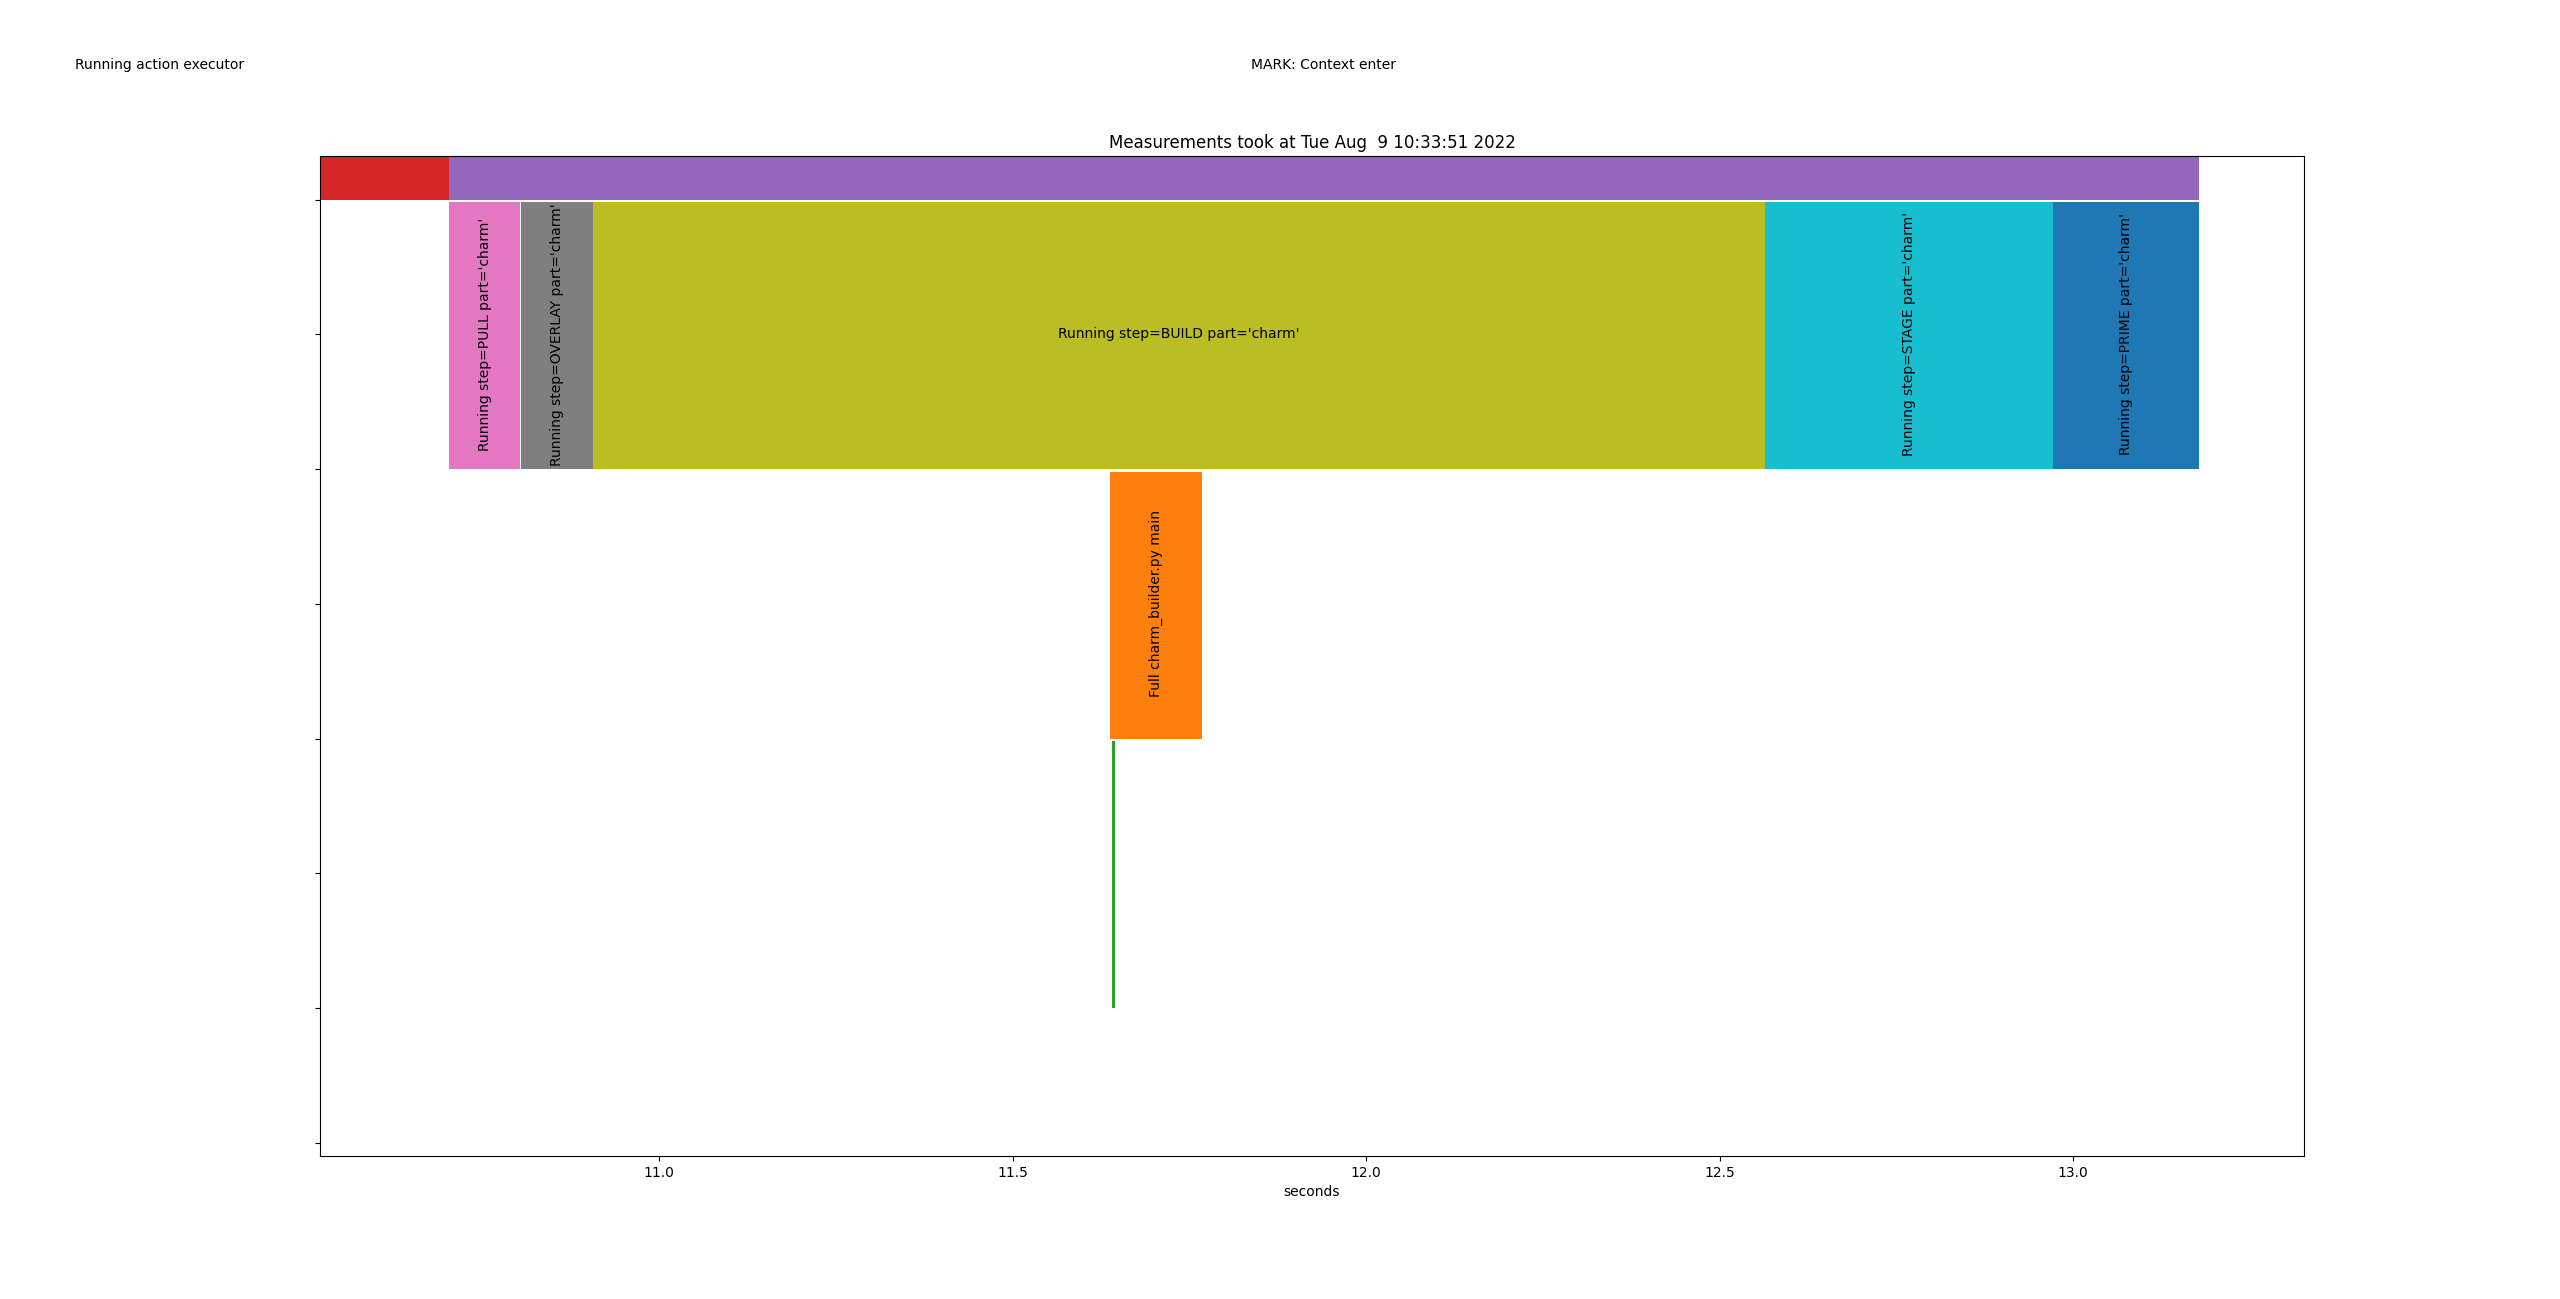
The following represents a more standard run: a charmcraft pack after a previous one having changed the source code:

Again, a zoom of the BUILD step:
I will continue working to improve the performance and giving us tools to understand better the pack process.
Any idea is welcomed! Thank you 