Monitoring Juju Controllers

Edited to move to the bundle with shared dashboard ready to go.

As we setup our important infrastructure we set up monitoring and alerting so that we can keep a close eye on infrastructure. As the services we provide grow and need to expand, or failures in hardware attempt to wreck havoc, we’re ready because of the due diligence that’s gone into monitoring the infrastructure and applications deployed. One thing I often see is that folks forget to monitor the tools that coordinates all of their deployment and configuration management. It’s a bit of a case of “who watches the watcher?”.

While building and operating JAAS (Juju as a Service) we’ve had to make sure that we follow the same best practices for our Juju hosting infrastructure that you’d use on your production systems you run in JAAS. This means that our Juju Controllers (the state and event tracking back end) need to be watched to make sure that we’re ready to prevent any issues we can see coming and know about issues as soon as possible for the ones we cannot.

Fortunately, there’s some great established tools for doing this. We use Prometheus, Grafana, and Telegraf to help us keep our JAAS infrastructure running smoothly. What’s better, is that there are Charms available for each that enable us to quickly and easily deploy, configure, and operate the monitoring setup. This means you can replicate the operational knowledge we’ve gained by reusing the same exact Charms we use in production.

Getting our Controller set up

Let’s walk through an example set up. First, we’ll create a new controller on GCE where we’re going to run our production applications. Note that this will work for any Controller on any cloud you choose to run Juju on.

$ juju bootstrap google production
...
Bootstrap complete, "production" controller now available.
Controller machines are in the "controller" model.
Initial model "default" added.

One interesting thing in the output at the end is that your “Controller machines” are in the controller model. We want to watch those so let’s switch to that model and work from there.

$ juju switch controller
production:admin/default -> production:admin/controller

The next thing we’re going to do is to make sure our controller is HA enabled so we have replication and resiliency to our controller.

$ juju enable-ha -n 3

While that goes forward let’s setup our monitoring user account we need so that we can ask Juju about the metrics it is capable of spitting out.

$ juju add-user prometheus
$ juju grant prometheus read controller
$ juju change-user-password prometheus
<enter a super secret password>

Next up we need to setup the bundle we’re going to use to tie together our monitoring infrastructure to our controller machines. For now, we have to cheat. Juju can only form relations between applications in the model and controllers aren’t an application in the model. We’re going to cheat by using a bundle that deploys a generic Ubuntu charm onto the controller machines and then use that to relate to our other infrastructure.

Let’s pull down the bundle we’re going to use to set things up.

$ charm pull cs:~juju-qa/controller-monitor
$ cd controller-monitor
$ ls
bundle.yaml  dashboard.json  overlay.yaml  README.md

We’ve got to tweak the bundle for our specific controller setup. We’re going to need the IP addresses of the controllers and the password we used above for our prometheus user account. The IP addresses are available in the juju status output.

$ juju status 
...
0        started  35.196.134.151  juju-e7e6c5-0  bionic  us-east1-b  RUNNING
1        started  34.73.102.169   juju-e7e6c5-1  bionic  us-east1-b  RUNNING
2        started  35.231.100.156  juju-e7e6c5-2  bionic  us-east1-c  RUNNING

… and edit the overlay.yaml we’ll use to tweak the install. Fill out the $IPADDRESS and the $PROMETHEUS_PASSWORD variables in the overlay.

prometheus:
  options:
    scrape-jobs: |
      - job_name: juju
        ...
        static_configs:
            - targets:
              - '$IPADDRESS0:17070'
             ...
            - targets:
              - '$IPADDRESS1:17070'
            ...
            - targets:
              - '$IPADDRESS2:17070'
            ...
        basic_auth:
          username: user-prometheus
          password: $PROMETHEUS_PASSWORD

With that we should be able to deploy our bundle onto our model and get things off to the races.

$ juju deploy ./bundle.yaml --overlay=overlay.yaml --map-machines=existing

This will deploy the monitoring infrastructure onto our existing three Juju controller machines. You can watch the status go through and once it settles we can load up Grafana and add our dashboard.

$ watch --color juju status --color

Once everything is settled we can ask Grafana for what the admin password is and load up the webui by going to the address of the unit.

$ juju run-action grafana/0 --wait get-login-info
unit-grafana-0:
  UnitId: grafana/0
  id: "1"
  results:
    password: 4Jg3PXJWTTkSprVx
    url: http://34.73.102.169:3000/
    username: admin
$ xdg-open http://34.73.102.169:3000/

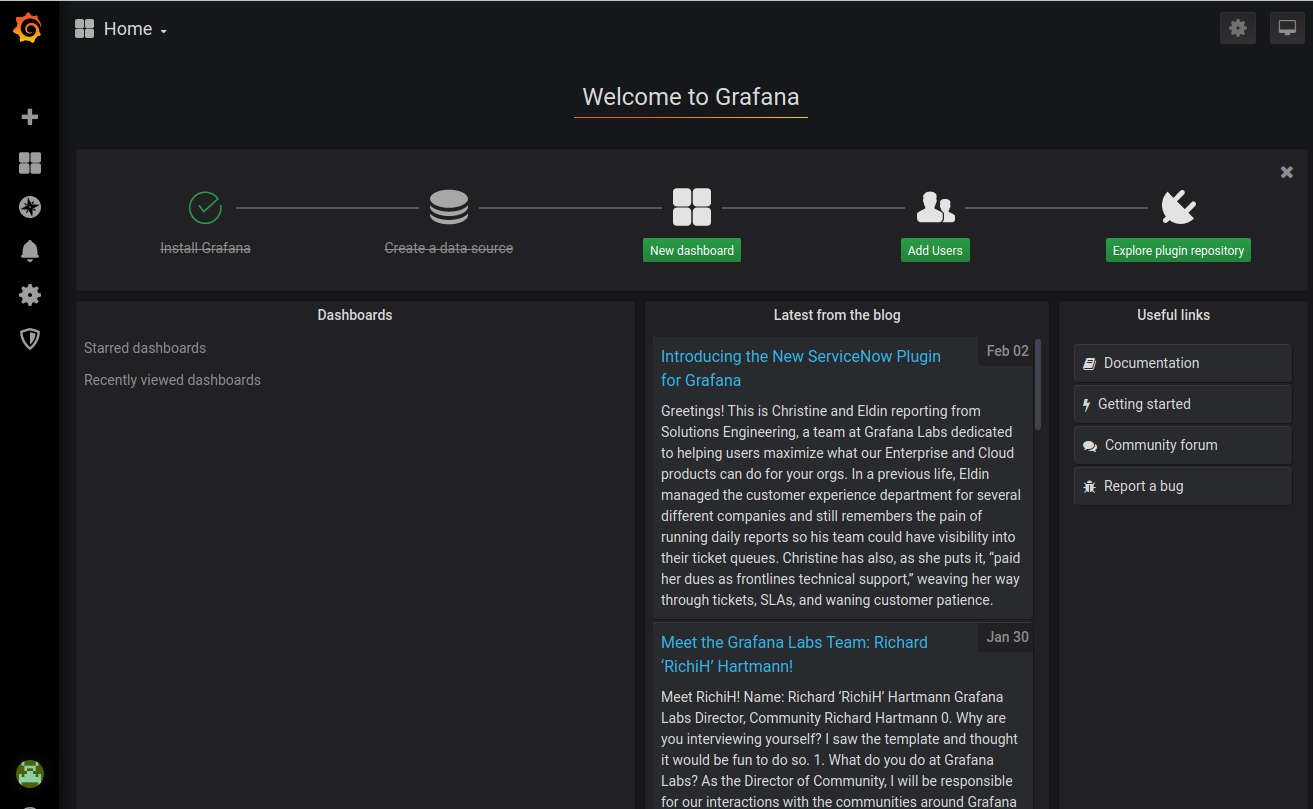
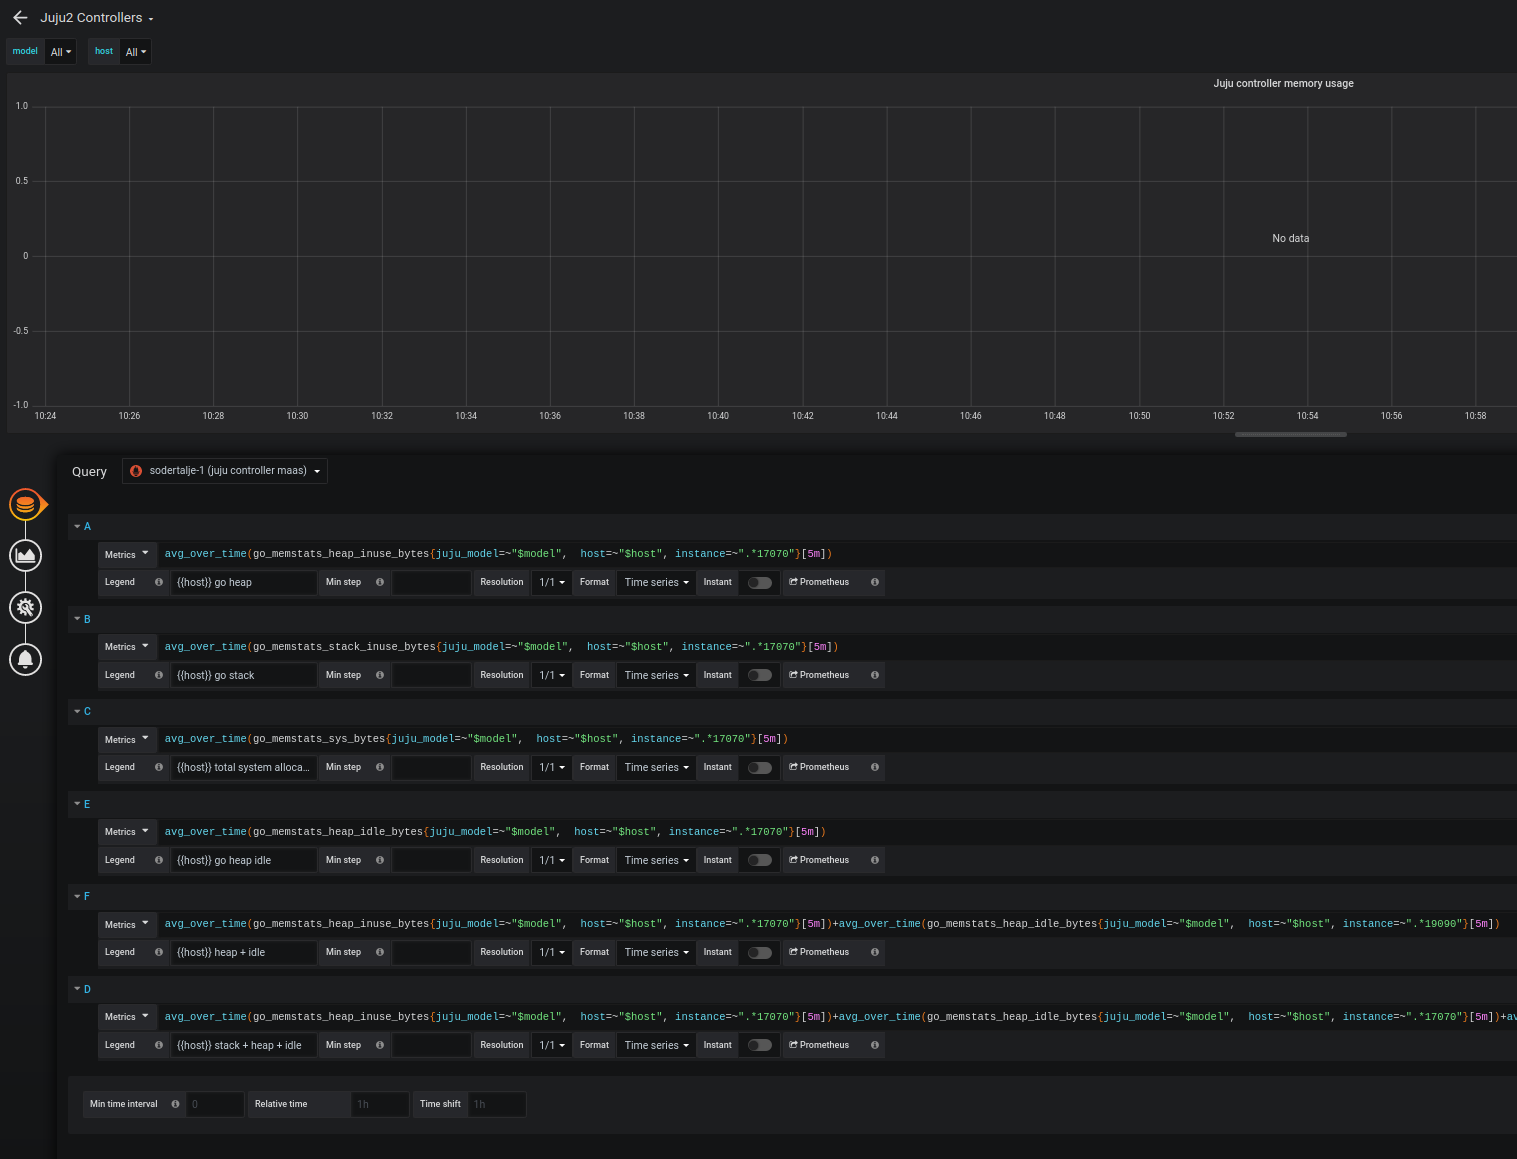
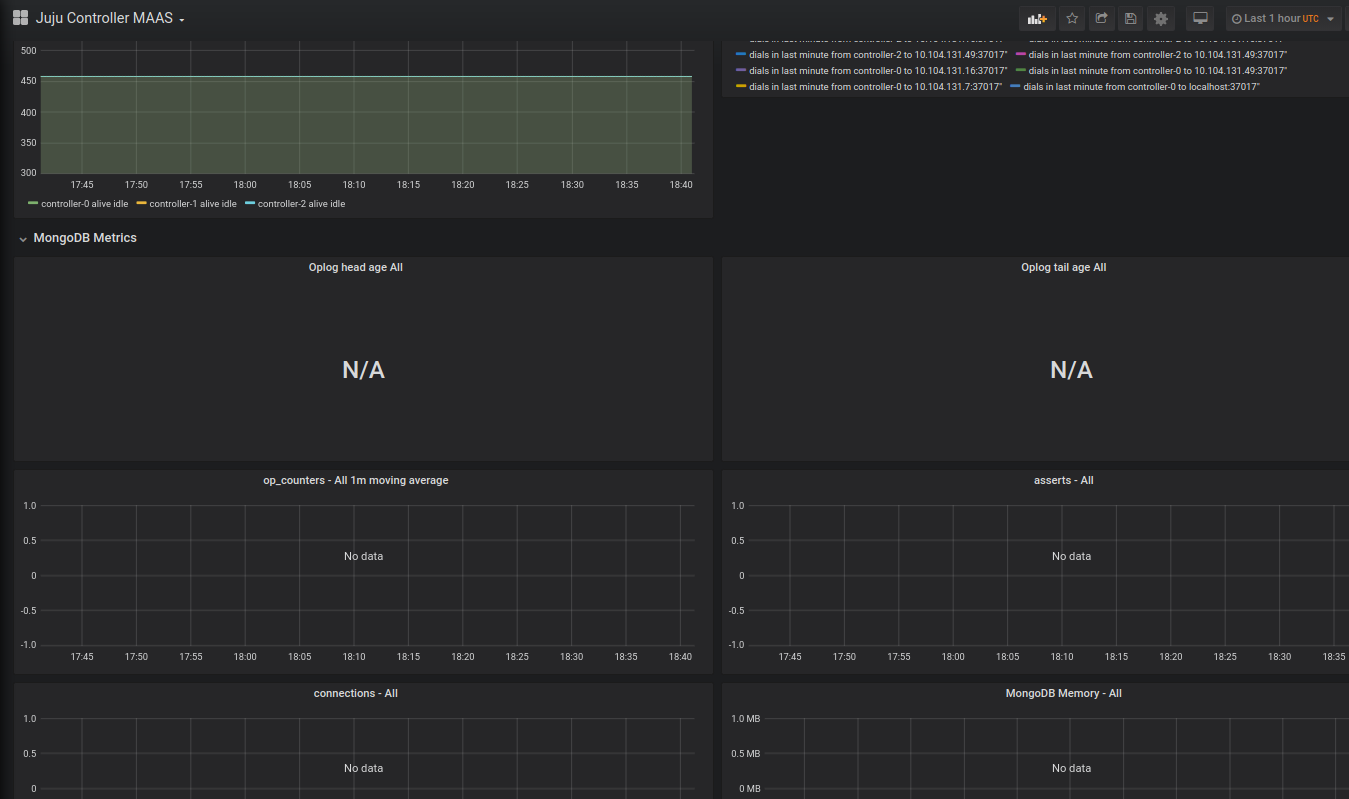
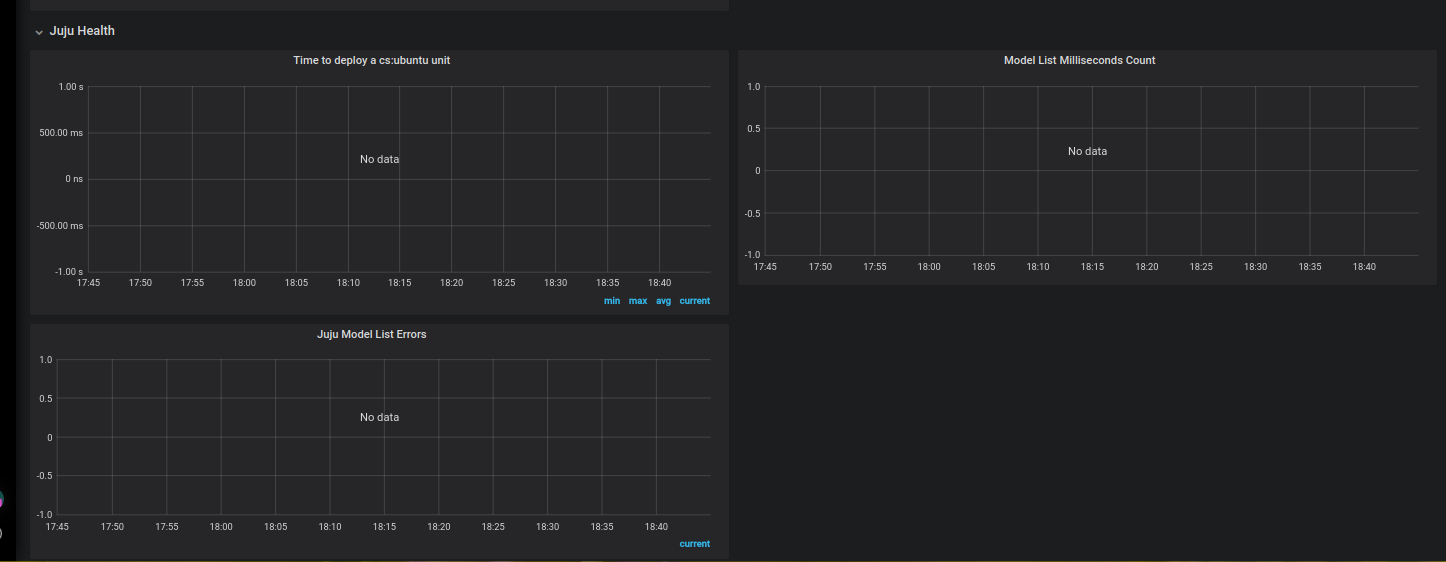
Once you’re logged in use the menu on the left to go to Dashboards->Manage->Import->upload json file. This will let us upload our dashboard.json file that’s in the controller-monitor directory we pulled down.

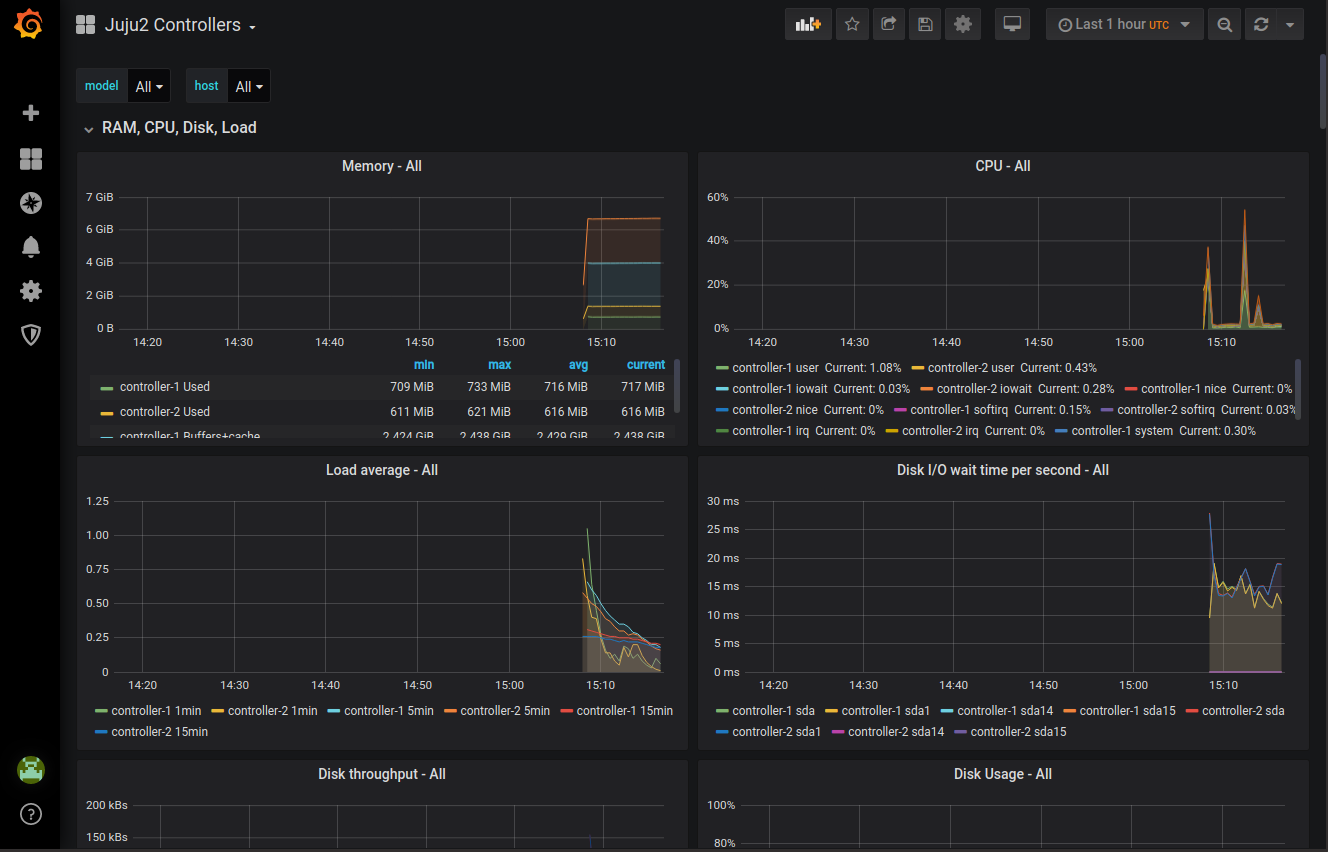
With that loaded you should have a pretty graph of data that you can use to kick off your controller monitoring project.

Where to go from here

Ideally we’d be able to not have to hand edit the overlay.yaml and be able to relate to the controller machines themselves. It might be interesting to have a more natural controller charm that we use instead of the ubuntu-lite charm.

We would setup alerting because what good is measuring if we don’t get a giant hint that things are heading out of whack?

What are we missing? Comment below with any issues you find following this or what other things you’d like to see in here!

7 Likes

Great post. We should extend it now the cross model relations is a thing; prometheus can be deployed to a separate model/controller and monitoring for a bunch of stuff centralised etc.

1 Like

Thanks, I’ve just ported what I had. I’m working on next steps to update it and bring it in line with more modern Juju. I can look at CMR for the collection tools as part of it as an optional path.

Ok, post update is complete. Updated the charms to prometheus2 and tested to make sure all the settings still worked out. Please let me know if you find anything and reach out and let me know what you’d like to see from here.

Thanks!

Very nice post. As we have setup (dec-2018) a “Candid” server to connect with a “beta-production” juju controller, we are going to mimic this fully.

We’ll let you in on our progress and findings. @hallback is also present in the work.

Any good advices appreciated.

1 Like

Awesome, I look forward to seeing how it turns out. My only advice is that definitely pay attention to things like controller load and disk usage as those things are strong indicators of issues that you might need to keep an eye on.

Something that caught me out, is that when setting up the prometheus metrics for the juju controller, the user name has to be “user-prometheus” and NOT the user you just created.

It does have to be user-<username>, but did you create a user other than ‘prometheus’ ?

Why do we get the user to namespace it, considering we could do that in the CLI?

The bytes-on-the-wire when logging into a Juju controller are always prefixed (machine-0, user-simon, unit-ubuntu-0). Juju normally does that for you when you do “juju login” because you can only login from the CLI as a “user”. However, Prometheus needs to send the right username to juju, and so must pass “user-simon” as part of the Basic Auth header in the HTTP request.

I should probably include my snippet that does a decent job with HA controllers:

- job_name: juju
  metrics_path: /introspection/metrics
  scheme: https
  static_configs:
      - targets: 
        - '<IP0>:17070'
        labels:
            host: controller/0
            juju_unit: controller/0
      - targets:
        - '<IP1>:17070'
        labels:
            host: controller/1
            juju_unit: controller/1
      - targets:
        - '<IP2>:17070'
        labels:
            host: controller/2
            juju_unit: controller/2
  basic_auth:
      username: "user-prometheus"
      password: "prometheus"
  tls_config:
      insecure_skip_verify: true

Note that it scrapes all the controllers, and then adds an extra label to each controllers metrics (juju_unit and host).

I also have a fairly big prometheus config that uses that. We’ve been iterating on the view we use on our Prodstack controllers, and having that available for my own little testing controller has been really useful.

I should also note that if you are using the default “juju deploy grafana” charms, they use https://packagecloud.io for the grafana packages. And that plays poorly with apt-cacher-ng. You have to allow proxying over HTTPS and they seem to use a lot of different websites. There was some advice that this might work:

PassThroughPattern: (packagecloud\.io|packagecloud-repositories\.s3\.dualstack\.us-west-1\.amazonaws\.com|packagecloud-prod\.global\.ssl\.fastly\.net|deb\.nodesource\.com|packages\.gitlab\.com|packages-gitlab-com\.s3\.amazonaws\.com|packagecloud-repositories\.s3\.amazonaws\.com):443$

However, I tried to set that in /etc/apt-cacher-ng/acng.conf and then sudo systemctl restart apt-cacher-ng and then do “sudo apt update” on the machine running grafana, and it gives me:

Err:6 https://packagecloud.io/grafana/stable/debian stretch Release
  Received HTTP code 403 from proxy after CONNECT
Reading package lists... Done
E: The repository 'https://packagecloud.io/grafana/stable/debian stretch Release' does not have a Release file.
N: Updating from such a repository can't be done securely, and is therefore disabled by default.
N: See apt-secure(8) manpage for repository creation and user configuration details.

However, if I switch to:

PassThroughPattern: .*:443$

It works. However, this allows apt-cacher-ng to proxy for any machine on your network to any https website. So don’t use it anywhere that security matters.

1 Like

I’ve updated the post with John’s HA setup and pushed up a bundle that has things a little easier to user with a dashboard ready to get started with. Thanks for the setup John!

Very nice. Definitely shows why we want to use relations rather than editing config files. We need to get that controller charm put together.

I’m trying to set up grafana with this and I don’t get any values for some of the graphs. Is the part you write here what I need to get my graphs going with @rick_h dashboard.json ?

I also have 3 controllers. My empty graphs looks like this… (below)

@erik-lonroth I’d suggest doing an expose at each step along the way and making sure you can load and see data from each service in the chain. So expose/check telegraf and the url there, then expose and check prometheus and make sure the telegraf data is available there, and then finally make sure that the right datasource is selected for the graphs in the grafana dashboard.

@rick_h - seems I got my head around fixing it with a bit of editing of the bundle and json.

I already had models going with machines and needed to update that a bit.

I roughly did:

  1. juju export-bundle > bundle.yaml
  2. Renamed prometheus -> prometheus2 in the bundle.yaml
  3. Did a "juju deploy bundle.yaml --overlay=overlay.yaml "
  4. Renamed the datasource in the template.json to my existing datasource name in grafana.
  5. Imported the template.json into grafana.
  6. … might have been something more =)

… and/but voila!

Now, there are a few sources related to the mongodb that isn’t showing up… any leads on what might go on there? (See picture of the current situation with mongodb)

Also, there is some parts from “juju health” at the very bottom (See image)

This is looking really good now. Thanx for this!

Is this still the only way to deploy subordinates such as node-exporter, NRPE and NTP on controllers?

I think so, but @hmlanigan might know better?

You can deploy the Ubuntu charm with the --to flag, then deployed the subordinates and relate.

e.g.
juju deploy ubuntu -m controller -n 3 --to 0,1,2
juju deploy ntp
juju relate ubuntu ntp

In juju 3.0 there will be a controller charm installed by default to use for this.

1 Like