So all good, but I have a few questions and observations for the maintainers of the lib and opentelemetry-collector:
Our cloud is LXD - so this would matter.
We are getting these errors which seems related to some configuration in either Loki or opentelemetry-collector, we have tried various settings but can’t seem to get rid of it, any clues here? We are not ingesting alot.
Nov 07 12:14:45 juju-e0574e-0 loki[22350]: level=error ts=2025-11-07T12:14:45.83051444Z caller=manager.go:49 component=distributor path=write msg="write operation failed" details="ingestion rate limit exceeded for user fake (limit: 4194304 bytes/sec) while attempting to ingest '100' lines totaling '24120' bytes, reduce log volume or contact your Loki administrator to see if the limit can be increased" org_id=fake
The node-exporter seems unhappy, this seems related to the snap (Bug report here) (which might be a LXD issue) - Can we turn off the node-exporter somehow in the charm/snap ? (we are running a separate node-exporter so this thing is not needed for us)
2025-11-13T17:44:30.799754+00:00 juju-67bc6e-0 node-exporter.node-exporter[1926175]: time=2025-11-13T17:44:30.799Z level=ERROR source=collector.go:168 msg="collector failed" name=logind duration_seconds=0.150347986 err="unable to get seats: An AppArmor policy prevents this sender from sending this message to this recipient; type=\"method_call\", sender=\":1.41393\" (uid=0 pid=1926175 comm=\"/snap/node-exporter/1904/bin/node_exporter --colle\" label=\"snap.node-exporter.node-exporter (enforce)\") interface=\"org.freedesktop.login1.Manager\" member=\"ListSeats\" error name=\"(unset)\" requested_reply=\"0\" destination=\"org.freedesktop.login1\" (uid=0 pid=293 comm=\"/usr/lib/systemd/systemd-logind\" label=\"unconfined\")"
Where is the “juju_unit” topology item coming from the opentelemetry-collector? Its not in grafana (We get almost everything else, but the juju_unit isn’t there)
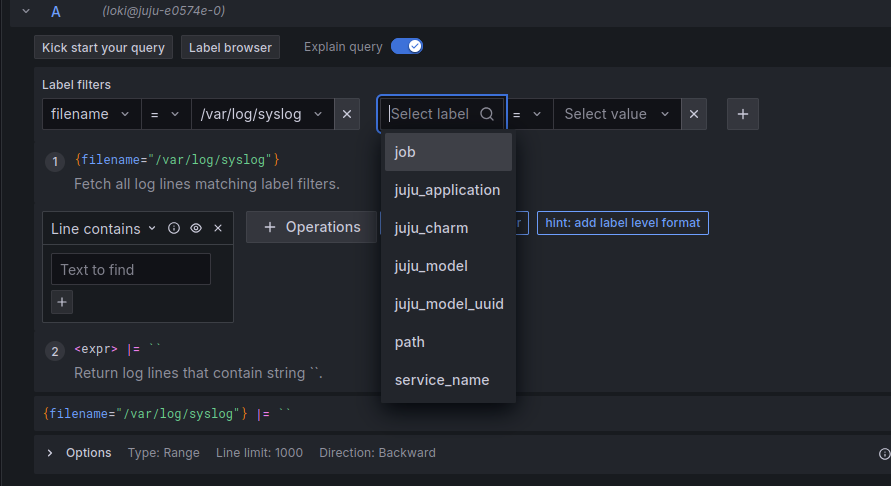
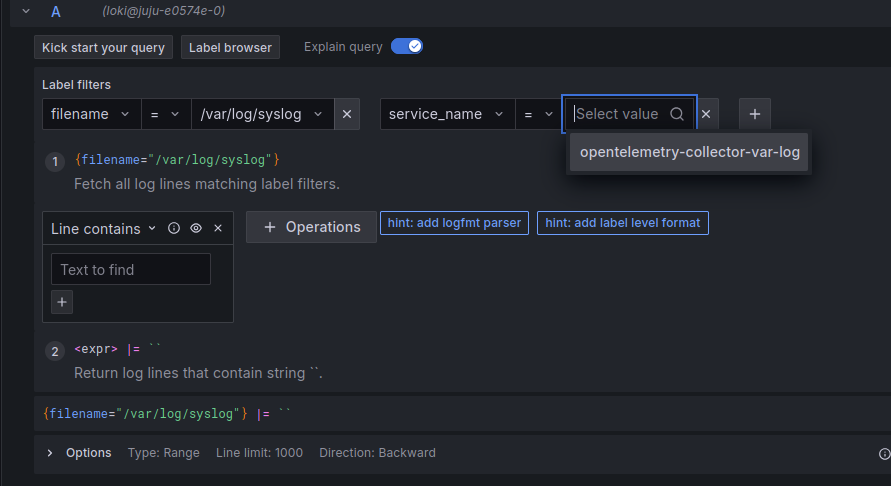
We don’t want to ship all the /var/log as this would start filling up the Loki. So, how can we filter out stuff on the local unit, based on for example our service, snap.polkadot.service) at the node? The service doesn’t have a logfile other than in /var/log/syslog.
We usually hope to monitor the principal application to which opentelemetry-collector is related. But the principal charm information is nowhere to be found. How can we get things from the principal charm - at the moment, everything is labeled opentelemetry-collector charm.
I have tried to increase this value to over 64MB at the Loki side of this, without getting rid of this. I suspect something else is going on. I can’t understand what goes on. Loki experts hello?
Right, ok. We will have to wait for this then.
I think this is wrong. Not providing a full topology breaks the contract promised by the whole idea of the juju topology. I would expect from working with the juju topology as a means to easily correlate problems which occurs in our environment based on this topology.
If we can’t get this, we would need to patch this in ourselves somehow, which I guess would be a fork of the whole telemetry-collector, which must be wrong.
Would our only option be to patch the systemd-unit-file to send logs to a specific file? It would be much better to provide a means to target a specific service on the host. (New feature?)
I see. I couldn’t fully understand what this would imply. I was actually trying at some point to do this myselfproviding a different relation to send data over to the subordinate, but I never got that all the way. But I really think this feature is needed since it make little sense to “monitor” the telemetry-collector itself when the purpose generally is to monitor the principal workload.
otelcol (and gagent) are subordinate charms, which means that if multiple principals are deployed --to the same machine, and if they are related to the same otelcol app, then multiple otelcol units will be deployed to that same machine as well.
We do not want to duplicate all the logs just to be able to slap e.g. juju_unit="otelcol/0" to one copy and juju_unit="otelcol/1" to another copy. Instead, we have only one copy of the logs, without juju_unit, but with instance.
Also, why would you want e.g. postgres logs labelled with otelcol unit? In any case, the instance label is somewhat equivalent to juju_unit.
I would find it very useful to be able to have a path_include config in this case as it would be a super clean way to track a single application, which is usually what I want.
Its kind of aggressive in my mind to default assume that EVERYTHING should be sent from a host/unit rather than be somewhat conservative. After all, filling up Loki with logs is expensive…
Why not start small with /var/log/syslog and expand from that?