
Keeping your prompts on your own hardware is a feature, not a compromise. The hard part was never the model - it is everything around it: a serving runtime, a gateway, autoscaling that reacts to real demand, and dashboards so you can see what is going on. Wiring all of that together by hand is a week you do not get back.
This post shows a different path. We take a system with 8× NVIDIA H100 GPUs, and with a single terraform apply we stand up a full LLM serving stack on Kubernetes: KServe for serving, an Envoy AI gateway in front, KEDA for metric-driven autoscaling, and the Canonical Observability Stack (COS) for metrics, logs and dashboards. Then we serve Mixtral-8x7B-Instruct across two GPUs, throw traffic at it, and watch KEDA add a second replica on its own. It is sparse mixture-of-experts model (46.7B total parameters, ~13B active per token) that delivers big-model quality - strong reasoning, coding, and multilingual skills over a 32K context - at a much lower inference cost. Along the way we also let the llm-integrator charm deploy a model for us - in disaggregated prefill/decode mode - without writing any YAML.
Everything here is charmed and driven by Juju, so the whole thing is reproducible. If Juju is new to you: it is an open-source orchestration engine where you deploy charms - operators that know how to install, configure, and integrate an application - and connect them over typed relations, instead of hand-writing manifests. Everything in this post is a charm, which is how the whole stack comes up and wires itself together with just a few commands. Non-charm code related to this demo can be found in a companion repo - github.com/misohu/charmed-llm-autoscaling - and I keep the snippets in the text short.
What we are building
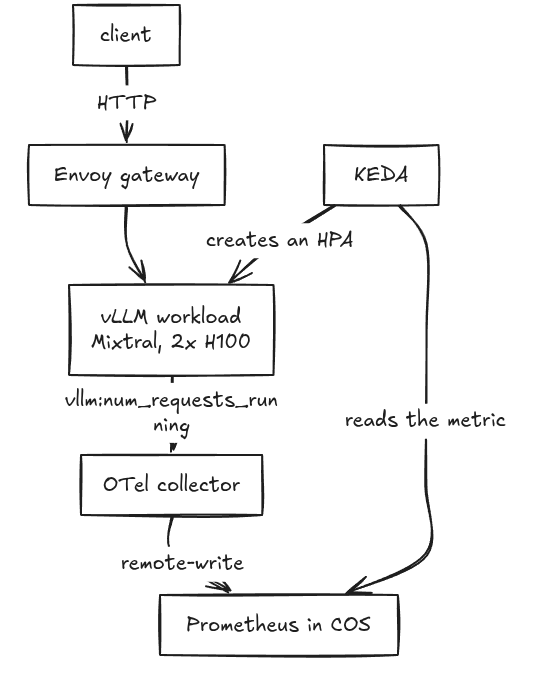
The cast, all Juju charms:
-
kserve-controller and kserve-llmisvc - the KServe control plane in its standard (
RawDeployment) mode, plus the LLM-specific pieces that turn anLLMInferenceServiceinto a running vLLM deployment. -
envoy-controller / envoy-ai-controller / envoy-ingress - the gateway that fronts the model.
-
lws-controller -
LeaderWorkerSet, used for multi-node serving (we do not need multi-node here, but the stack ships with it). -
keda-controller - KEDA, the autoscaler.
-
opentelemetry-collector-k8s - scrapes the workload metrics and remote-writes them to COS.
-
COS Lite - Prometheus, Loki, Grafana, Alertmanager, Traefik, in their own Juju model.
One detail worth calling out now, because it matters later: the vLLM metrics do not go straight to Prometheus. The OTel collector in the serving model scrapes them and remote-writes to the Prometheus that lives in the Canonical Observability Stack (COS) namespace. KEDA then reads that same Prometheus. It is a clean separation - the serving cluster does not run its own monitoring database - and it works transparently.
The machine and the platform
The node is a single beefy box: 8× NVIDIA H100 80GB HBM3. The platform underneath is the usual Canonical set-up. We assume you already have an Ubuntu 24.04 VM with GPUs; on top of it we need three things:
-
Canonical Kubernetes as the cluster management system
-
NVIDIA GPU Operator so pods can request
nvidia.com/gpu -
concierge to bootstrap the cluster and Juju in one shot.
The full, copy-pasteable script is in the companion repo (setup/prepare-machine.sh); the essence is:
# Helm, plus the snaps we need
sudo apt-get install -y helm       # from the Helm apt repo - see the script
sudo snap install terraform --channel latest/stable --classic
sudo snap install concierge --classic
sudo snap install juju --channel 3.6/stable --classic

# Bootstrap Canonical Kubernetes + Juju (uses concierge.yaml - set your LB CIDR!)
sudo concierge prepare --trace

# NVIDIA GPU Operator
helm repo add nvidia https://helm.ngc.nvidia.com/nvidia && helm repo update
helm install --generate-name -n gpu-operator-resources --create-namespace nvidia/gpu-operator
A quick tour of what just happened. concierge prepare does the heavy lifting: it installs Canonical Kubernetes and bootstraps a Juju controller - the small service that manages every deployment from here on - and points Juju at the new cluster. The Helm step adds the NVIDIA GPU Operator so Kubernetes can actually schedule nvidia.com/gpu resources. Once the GPU operator finishes its validation, you should see its pods running and in ready state:

To double check that the GPU operator did it’s job you should be able to run command nvidia-smi which will list available GPUs on your machine. With that, we have a Kubernetes cluster powered by H100s, and a Juju controller ready to deploy charms. Time for the interesting part.
One Terraform apply for the whole stack
The serving stack and COS are packaged as Terraform modules in the autoscaling-model-serving repo. The llm-cos deployment is the one we want: it deploys the LLM serving product and stands up COS Lite, wired together:
git clone https://github.com/canonical/autoscaling-model-serving.git
cd autoscaling-model-serving && git checkout track/0.3
cd terraform/deployments/llm-cos

terraform init
terraform apply
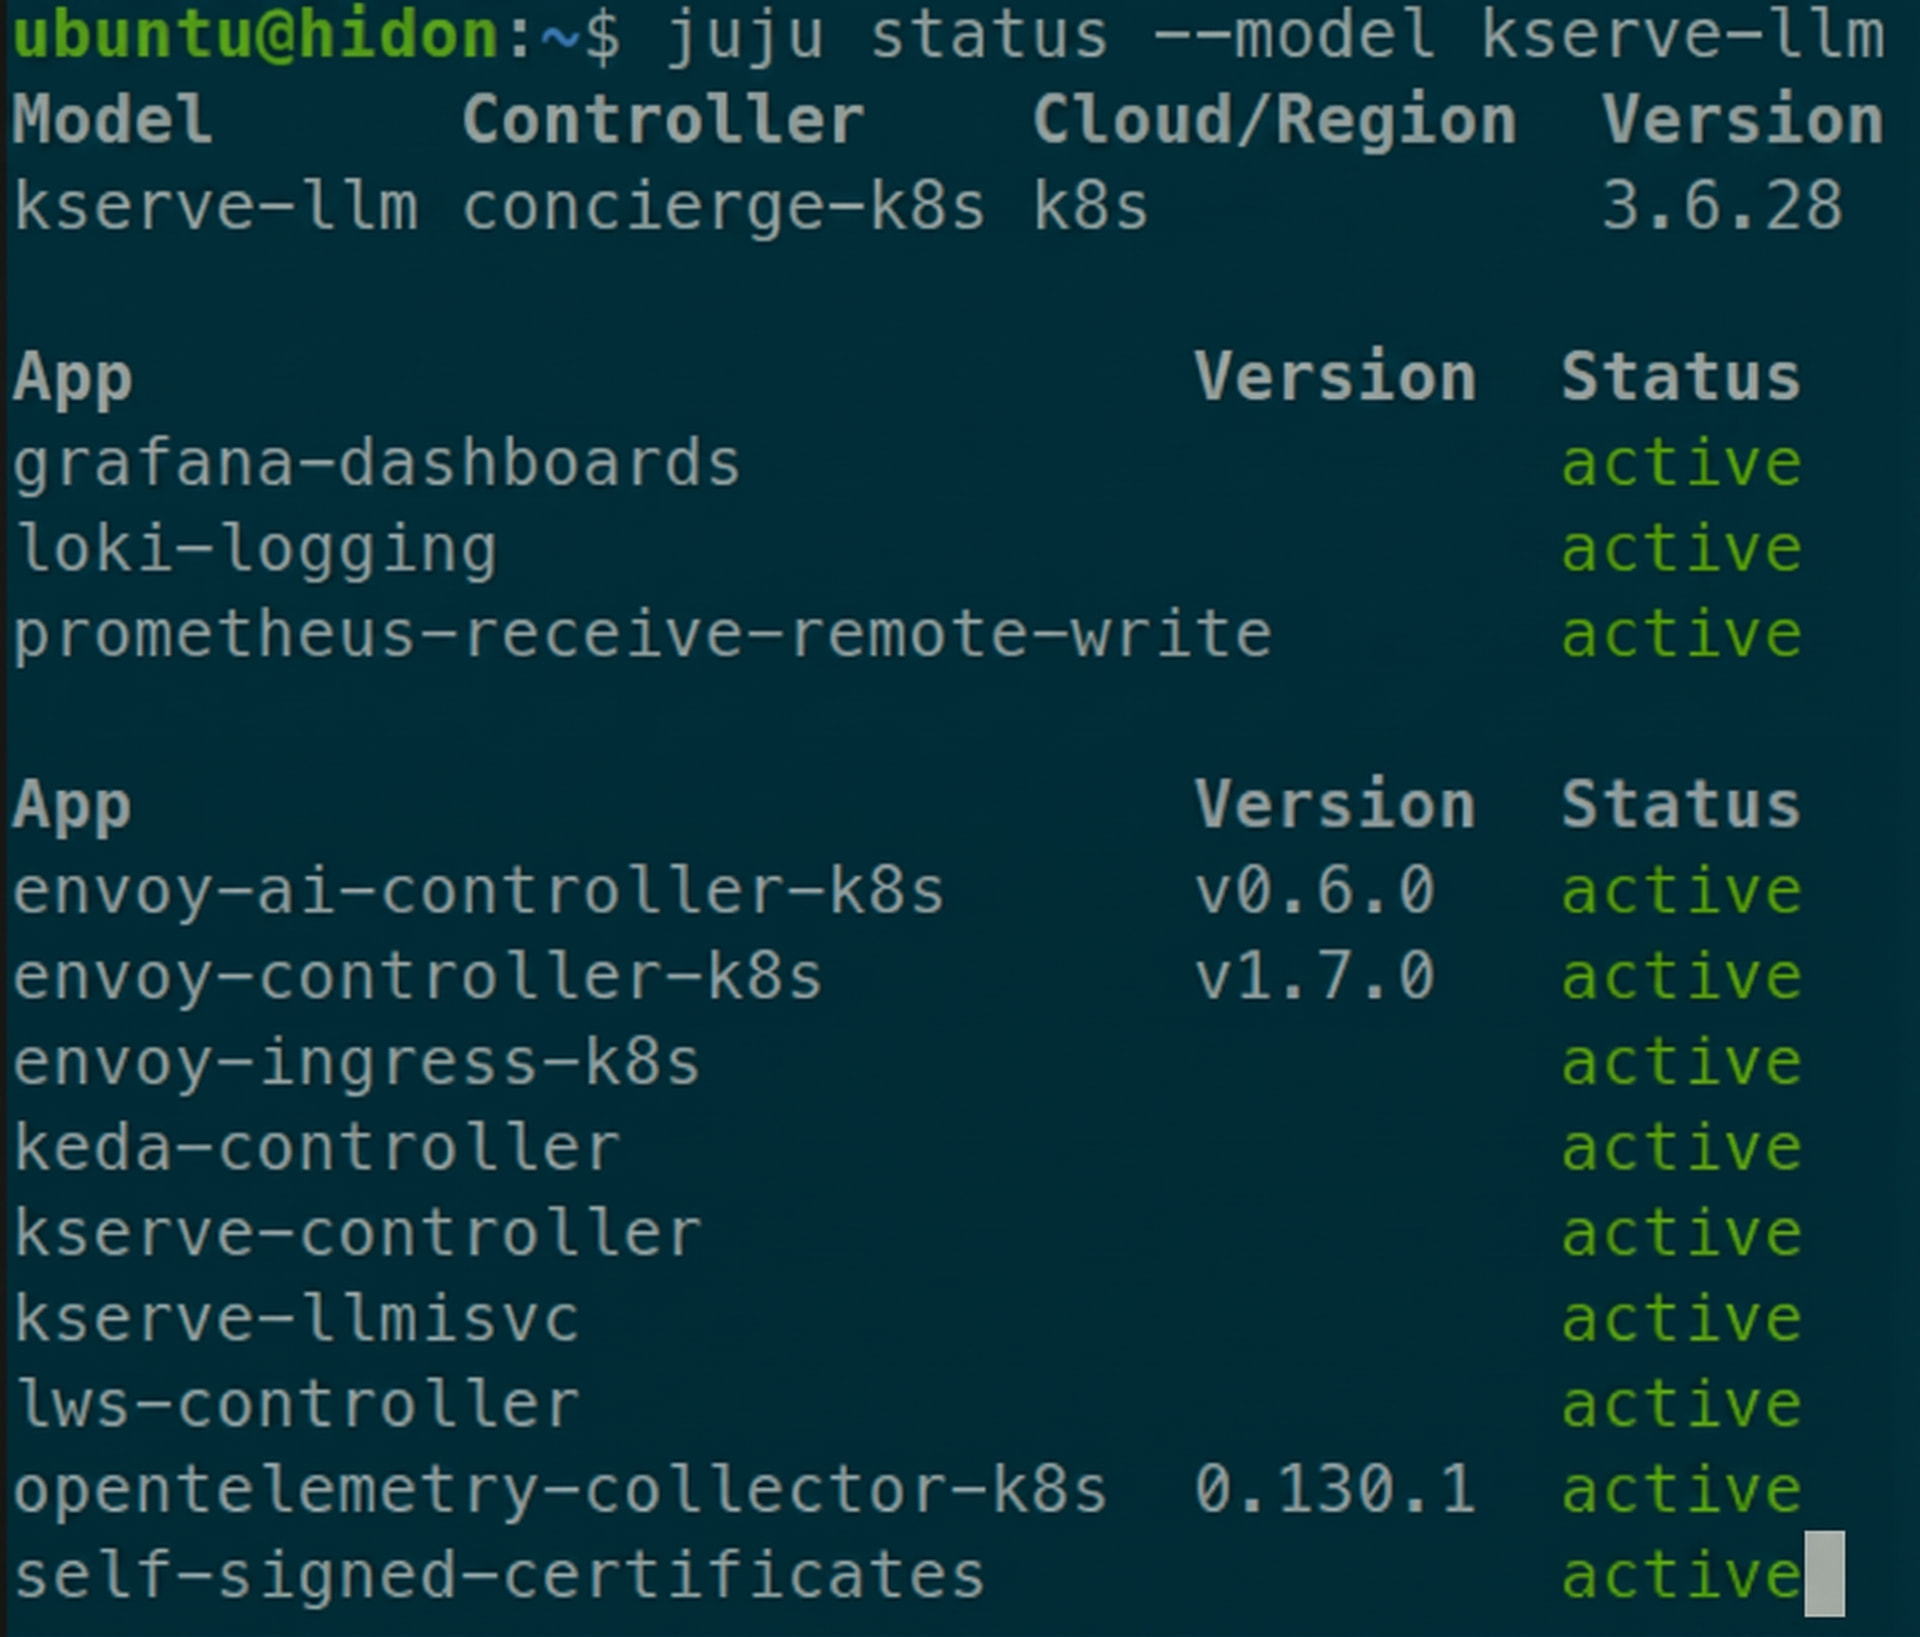
That triggers the full deployment sequence. Terraform spins up the cos model and deploys COS Lite into it. Next, it deploys the LLM-serving charms into a separate kserve-llm model, starts the OpenTelemetry collector, and links both models using observability offers. (Quick side note: when I say ‘model,’ I mean a Juju model—which, in this case, is just a dedicated Kubernetes namespace for these charms.) You can always check the status of a model with command juju status --model <model-name>. Go grab a coffee! By the time you’re back, both models will be solid green:
Serving Mixtral on two GPUs
KServe’s LLM support is driven by a custom resource, the LLMInferenceService. You describe the model and the workload pod; KServe builds the deployment, the routing and the service. We want Mixtral-8x7B-Instruct - an Apache-2.0 mixture-of-experts model that is too big for a single 80GB card, so it is a genuine excuse to use tensor parallelism across two GPUs.
The only non-obvious bit is how you tell the charmed vLLM image to be shared across two GPUs: you pass --tensor-parallel-size 2 as container args, and you request nvidia.com/gpu: 2. Here is the core of the manifest (the full version, including the model download tweaks below, is in the companion repo):
First, the Hugging Face token as a Secret, so it never lives in the manifest:
apiVersion: v1
kind: Secret
metadata:
  name: hf-token
  namespace: default
type: Opaque
stringData:
  HF_TOKEN: "<your-hf-token>"
Then the model itself:
apiVersion: serving.kserve.io/v1alpha2
kind: LLMInferenceService
metadata:
  name: mixtral
  namespace: default
spec:
  model:
    uri: hf://mistralai/Mixtral-8x7B-Instruct-v0.1
    name: mistralai/Mixtral-8x7B-Instruct-v0.1
  storageInitializer:
    enabled: false
  # No static replicas on purpose - KEDA will own the replica count.
  router:
    scheduler: {}
    route: {}
  template:
    volumes:
      - name: kserve-pvc-source
        emptyDir: {}
    initContainers:
      - name: storage-initializer
        image: docker.io/charmedkubeflow/storage-initializer:0.17.0-07d37fb
        args: ["hf://mistralai/Mixtral-8x7B-Instruct-v0.1", "/mnt/models"]
        env:
          - name: HF_TOKEN
            valueFrom:
              secretKeyRef: { name: hf-token, key: HF_TOKEN }
        volumeMounts:
          - { name: kserve-pvc-source, mountPath: /mnt/models }
    containers:
      - name: main
        image: docker.io/charmedkubeflow/vllm-cuda-gpu:0.19.0-e511371-20260702095505
        args: ["--tensor-parallel-size", "2"]         # shard across 2 GPUs
        env:
          - name: HF_TOKEN
            valueFrom:
              secretKeyRef: { name: hf-token, key: HF_TOKEN }
        volumeMounts:
          - { name: kserve-pvc-source, mountPath: /mnt/models, readOnly: true }
        resources:
          requests: { cpu: "4", memory: 32Gi, nvidia.com/gpu: "2" }
          limits:   { cpu: "8", memory: 96Gi, nvidia.com/gpu: "2" }
A word on the download. Mixtral’s Hugging Face repo ships the weights twice - modern
*.safetensors(~93 GB, which vLLM uses) and the olderpytorch_model-*.binfiles. A plainhf://pull grabs everything, ~190 GB, and it lands in a per-podemptyDir, so every replica downloads its own copy. For a real deployment you want to trim this - either download only the safetensors (huggingface_hub’sallow_patterns=["*.safetensors","*.json","*.model"]) or, better, stage the model once in S3 (or a shared read-only volume) so new replicas start fast. We kept the simplehf://path here to keep the manifest honest; the repo has the > faster variants.
Apply it, and after the download and model load, KServe reports the service ready and both the workload and its router are running:

Is it really using both GPUs? Let’s peek inside the pod:
$ kubectl -n default exec mixtral-kserve-... -c main -- \
    nvidia-smi --query-gpu=index,name,memory.used,memory.total,utilization.gpu --format=csv
index, name, memory.used [MiB], memory.total [MiB], utilization.gpu [%]
0, NVIDIA H100 80GB HBM3, 75697 MiB, 81559 MiB, 100 %
1, NVIDIA H100 80GB HBM3, 75697 MiB, 81559 MiB, 100 %
Both H100s, ~75 GB each, pegged at 100% under load. vLLM confirms the same at start-up (these lines rotate out quickly because vLLM is chatty, but they are worth showing once):
non-default args: {'model': '/mnt/models', 'tensor_parallel_size': 2, ...}
Initializing a V1 LLM engine (v0.19.0) with config: ... tensor_parallel_size=2 ...
DP group leader: ... world_size=2, local_world_size=2
(Worker pid=1031) world_size=2 rank=0 local_rank=0 ... backend=nccl
(Worker_TP1 pid=1032) rank 1 in world size 2 ...
Now the fun test - talk to it through the gateway. Let’s first get the external IP from the envoy ingress gateway:
GW=$(kubectl -n kubeflow get gateway envoy-ingress-k8s \
      -o jsonpath='{.status.addresses[0].value}')
And let’s post our query to the LLM:
curl -sS "http://$GW/default/mixtral/v1/completions" \
  -H 'Content-Type: application/json' \
  -d '{"model":"mistralai/Mixtral-8x7B-Instruct-v0.1",
       "prompt":"Explain tensor parallelism to a developer in exactly two sentences.",
       "max_tokens":80,"temperature":0.3}'
A real answer, from our own model, on our own GPUs:
Tensor parallelism is a technique for distributing the computation of a single tensor operation across multiple GPUs. It allows you to scale up the size of your models and datasets beyond what a single GPU can handle, without sacrificing performance.
Skip the YAML: the llm-integrator charm
Hand-writing an LLMInferenceService gives you full control, and sometimes that is exactly what you want. But often you just want a model up and complex YAMLs seem daunting. For this reason we created the llm-integrator charm, which renders the LLMInferenceService for you from a handful of config options - no YAML.
It can pull the model from Hugging Face (an hf:// URI plus a token secret) or from S3 (relate it to the s3-integrator charm, which provides the bucket and credentials). Here is the S3 path - the same one our integration tests use. First s3-integrator, with the bucket coordinates and the credentials as a Juju secret:
juju deploy s3-integrator --channel 2/edge \
  --config endpoint="https://s3.eu-central-1.amazonaws.com" \
  --config region="eu-central-1" \
  --config bucket="my-model-bucket"

SECRET_URI=$(juju add-secret s3-creds \
  access-key="$AWS_ACCESS_KEY_ID" secret-key="$AWS_SECRET_ACCESS_KEY")
juju grant-secret s3-creds s3-integrator
juju config s3-integrator credentials="$SECRET_URI"
Then deploy llm-integrator itself, pointed at the model and related to both kserve-llmisvc and s3-integrator:
juju deploy llm-integrator --channel latest/edge --trust \
  --config model-uri="s3://my-model-bucket/pythia-70m" \
  --config model-name="EleutherAI/pythia-70m" \
  --config runtime-image="docker.io/charmedkubeflow/vllm-cpu:0.19.0-…" \
  --config storage-initializer-image="docker.io/charmedkubeflow/storage-initializer:0.17.0-…"

juju integrate llm-integrator:kserve-llmisvc kserve-llmisvc:kserve-llmisvc
juju integrate llm-integrator:s3-credentials s3-integrator:s3-credentials
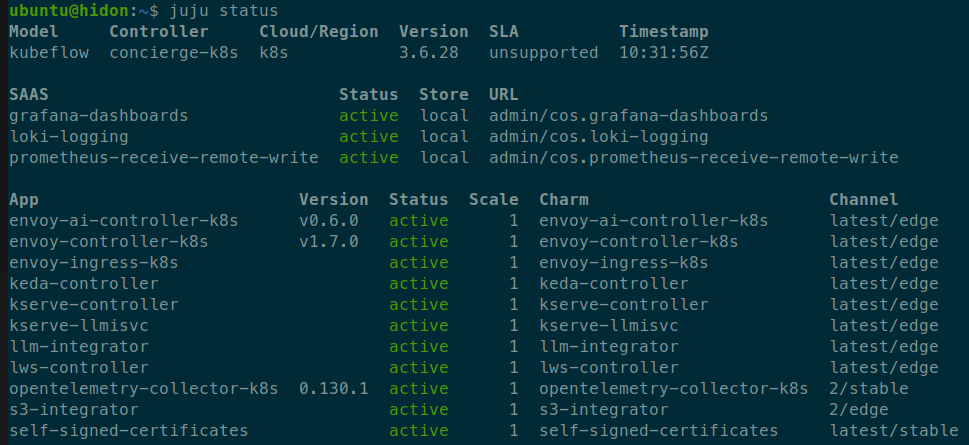
A minute later both charms are active - the charm has created and wired the model for you, no kubectl apply in sight:
Do you prefer Hugging Face? Drop s3-integrator, set
--config model-uri=hf://…and point--config hf-token-secret=at a Juju secret holding your token.
A bonus: disaggregated serving, out of the box
Look at the pods the charm produced and you will spot something more interesting than “it made an LLMInferenceService”:

There is a prefill pod, a decode pod and a router-scheduler - not one monolithic server. That is disaggregated serving, and llm-integrator turns it on by default (enable-prefill-decode=true).
Why split them? LLM inference has two very different major phases. Prefill processes the whole prompt in one shot to produce the first token and the KV cache - it is compute-bound and bursty. Decode then generates the rest of the answer one token at a time, reusing that cache - it is memory-bandwidth-bound and runs far longer. Put both on the same replica and they fight: a big prefill stalls the token stream of everyone who is mid-decode. Disaggregated serving runs prefill and decode on separate pods, typically scheduled on separate nodes, hands the KV cache from one to the other, and lets a scheduler route requests - so each phase can be scaled and sized on its own.
Under the hood this is llm-d, which KServe’s LLMInferenceService integrates and Canonical’s charms support out of the box. If you want to go deeper, vLLM’s disaggregated prefilling docs and the DistServe paper are good starting points.
We used a tiny CPU model (pythia-70m) here just to show the mechanism cheaply - but this is exactly the knob you reach for when a large model’s latency starts to suffer under mixed prefill and decode load.
Autoscaling with KEDA
Before we scale anything, it is worth seeing why the routing layer and the autoscaler lean on the same signal. Requests enter through the Envoy gateway, where Envoy AI Gateway and llm-d make the routing decisions together - and they are LLM-aware, not round-robin. By watching real-time signals like KV-cache affinity, queue depth and GPU memory pressure, they steer each request away from a saturated pod and onto the replica (or the prefill/decode phase) best placed to serve it.
That same signal is what makes autoscaling work. Plain CPU or GPU-utilisation scaling falls flat for LLMs: a pod’s VRAM sits at 100% allocated whether it is handling one request or a hundred, so raw utilisation tells you nothing about load. llm-d fixes this by exporting request-level metrics - vllm:num_requests_running, queue depth, KV-cache saturation - straight to Prometheus. The gateway uses them to balance traffic, and KEDA uses the very same numbers to decide when to add a replica.
Back to our Mixtral service. One replica is fine until it isn’t: when requests start queuing, you want more replicas; when the rush is over, you want the GPUs back. That is exactly what KEDA does - it scales a workload on any metric, and here the perfect metric is already being exported by vLLM: vllm:num_requests_running, the number of in-flight requests.
To enable this, we just need to create a KEDA ScaledObject., and the keda-controller that is already deployed will take care of the rest. The ScaledObject points at the Prometheus in the COS model (reached in-cluster, cross-namespace), reads our metric, and from it KEDA builds and manages a standard Kubernetes HPA:
apiVersion: keda.sh/v1alpha1
kind: ScaledObject
metadata:
  name: mixtral
  namespace: default
spec:
  scaleTargetRef:
    name: mixtral-kserve
  minReplicaCount: 1
  maxReplicaCount: 2
  pollingInterval: 15
  cooldownPeriod: 60
  triggers:
    - type: prometheus
      metadata:
        serverAddress: http://prometheus.cos.svc.cluster.local:9090
        query: 'sum(vllm:num_requests_running{k8s_namespace="default",k8s_pod_name=~"mixtral-kserve-.*"})'
        threshold: "1"          # ~1 in-flight request per replica
Now we generate some load. Nothing fancy - 48 concurrent requests with long generations, so requests actually pile up:
URL="http://$GW/default/mixtral/v1/completions"
seq 1 100000 | xargs -P 48 -I{} curl -s -o /dev/null --max-time 180 "$URL" \
  -H 'Content-Type: application/json' \
  -d '{"model":"mistralai/Mixtral-8x7B-Instruct-v0.1",
       "prompt":"Write a long, detailed essay on the history of computing.",
       "max_tokens":512,"temperature":0.9}'
Within a couple of KEDA poll intervals, the metric shoots up and the HPA reacts:
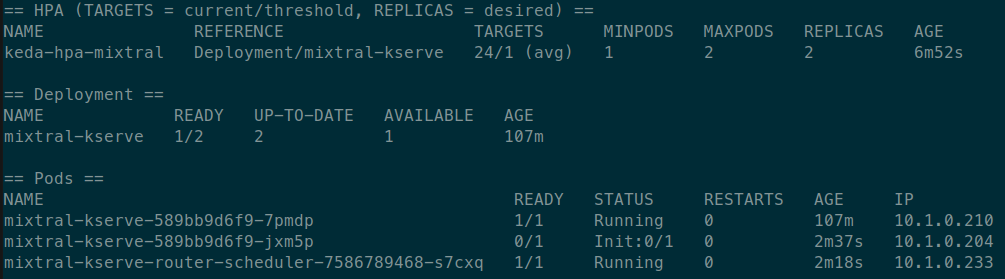
There it is: 48 requests in flight, the metric far above the threshold, and KEDA bumps the desired replicas from 1 to 2. A second mixtral-kserve-* pod appears and starts claiming its two H100s.
Two honest notes here. First, the scaling decision is instant - the HPA flips to 2 the moment the queue builds. Second, the new pod has to pull the model before it can serve, so it spends a few minutes warming up before the deployment reaches 2/2 ready and the load spreads across both replicas. This is exactly why staging the model in S3 or a shared volume matters: with a warm model source, the second replica is ready in seconds instead of minutes. When the traffic stops, the metric drops, and after the cooldown KEDA scales back to a single replica - GPUs returned.
Seeing it all in Grafana
Because the stack is autowired to the Canonical Observability Stack (COS), the observability is not an afterthought - the kserve-llmisvc charm ships a Grafana dashboard for exactly this. Open Grafana in the COS model and you get the vLLM view for free:
# Grafana runs in the `cos` model. This action prints the dashboard URL
# and the admin password (username is `admin`).
juju run grafana/0 -m cos get-admin-password
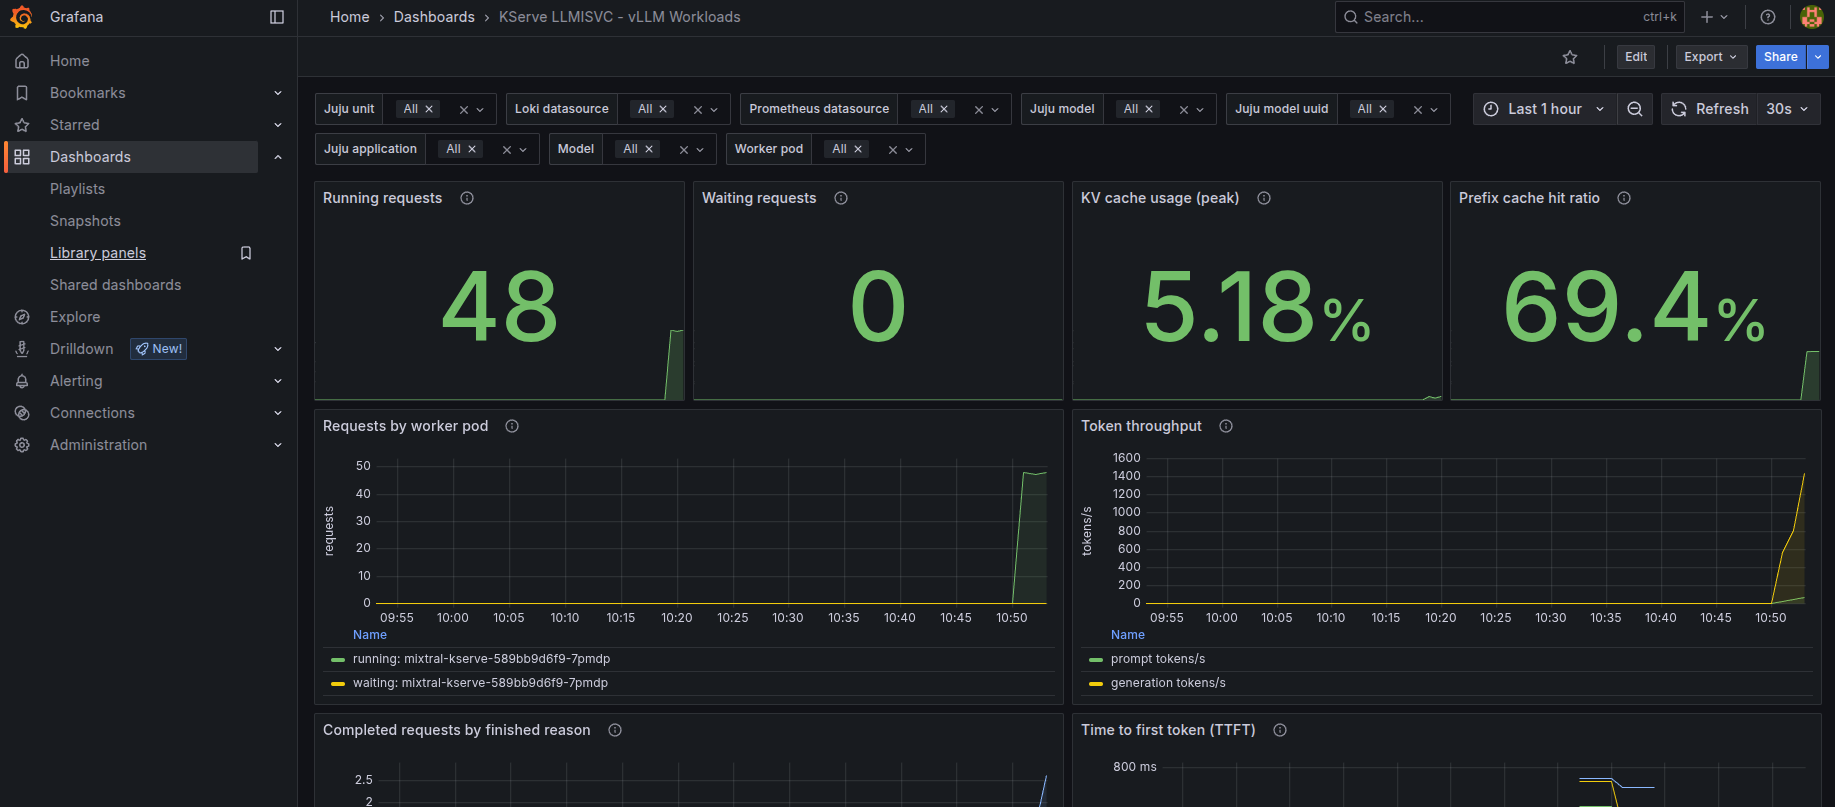
Running vs waiting requests, token throughput (prompt and generation tokens per second), time-to-first-token percentiles, KV-cache utilisation, prefix-cache hit ratio, and a per-pod breakdown. During our load test you can watch running requests jump to ~48 and generation throughput climb into the thousands of tokens per second - and, on the same timeline, the replica count steps up. That single screen is the whole story: demand rose, the system saw it, and it scaled.
Wrapping up
Starting from a bare GPU box, we:
-
brought up Kubernetes + the NVIDIA GPU operator + Juju,
-
deployed a full LLM serving stack and COS with one Terraform apply,
-
served Mixtral-8x7B across two H100s with tensor parallelism,
-
let the llm-integrator charm deploy a second model from config, in disaggregated prefill/decode mode,
-
autoscaled the GPU model with KEDA on a live vLLM metric, and
-
watched the whole thing in a ready-made Grafana dashboard.
None of it needed bespoke glue. The serving, the gateway, the autoscaler and the observability are all charms, composed by Terraform and orchestrated by Juju - so you can tear it down and stand it back up, on your hardware, and get the same result.
The same pattern goes further than this demo: KEDA has 60+ scalers (Kafka lag, queue depth, cron, custom metrics), so “scale my model on X” is rarely more than a different ScaledObject. And the models are yours to choose.
The full manifests, the load script and the exact commands are in the companion repo: github.com/misohu/charmed-llm-autoscaling.
Useful links:
- KServe charms: github.com/canonical/kserve-operators
- Terraform solution: github.com/canonical/autoscaling-model-serving
- KEDA: keda.sh
- Canonical Observability Stack: charmhub.io/topics/canonical-observability-stack
- Disaggregated serving: llm-d.ai