Looking for some help debuging why grafana-dashboard isnt getting all json

I’m trying to use the “grafana-dashboard” interface from the grafana vm charm to ship a custom dashboard to grafana.

Here is my code: https://github.com/erik78se/juju-operators-examples/tree/main/grafana-dashboard-example

The problem described in this post is that “A” dashboard is created, but it doesn’t contain the dashboard I sent but rather some “default/empty” one.

I have actually, on some occasion, got it to work - but I can’t reproduce that success. So, the strategy works - its probably some detail I’ve missed out on… Not sure.

I’m looking for some help to debug it.

@cory_fu has written previous code which I’m trying to mimic by basically just setting two keys in the relation_joined event.

dashboard: {dashboard json goes here}
name: "a name"

https://github.com/juju-solutions/interface-grafana-dashboard

I have also got some inspiration from this ceph-dashboard charm.

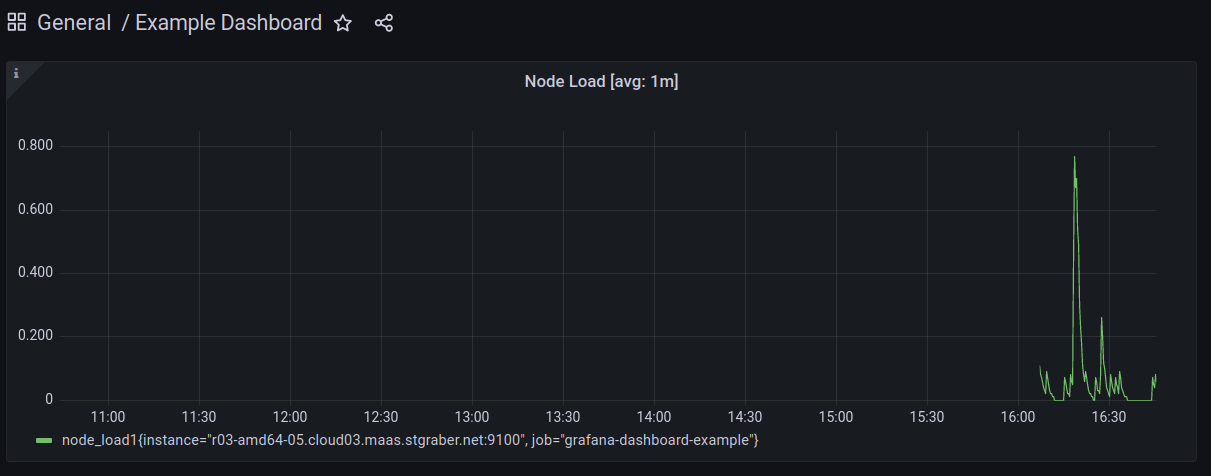
I could use some help here to understand why my json isn’t finding its way into a working dashboard. My dashboard is super simple and works.

To replicate this.

git clone https://github.com/erik78se/juju-operators-examples
charmcraft pack
juju add-model grafana-example
juju model-config default-series=focal
juju model-config logging-config="<root>=WARNING;unit=TRACE"

juju deploy grafana
juju deploy ./grafana-dashboard-example_ubuntu-20.04-amd64.charm
juju relate grafana grafana-dashboard-example

# Visit nagios http://grafana:3000
# Get admin password:
juju run-action grafana/0 get-admin-password --wait

# Look at the data sent to the unit
juju show-unit grafana/0 

In the juju debug-log you can see that the full json is visible in the logs. However if you do

juju show-unit grafana/0

Most of the json is not there, it seems that whatever I send to grafana, only some kind of default values are handled. Is the relation perhaps creating something automatically using default values, or am I sending data in the wrong way or whats going on…

[Update]: status=404 in the logs.

When the relation formed and I think that perhaps API:s might be called or something, this fires in the /var/log/grafana/grafana.log

==> grafana.log <==
logger=context t=2022-04-10T08:20:03.27+0000 lvl=info msg="Request Completed" method=POST path=/api/dashboards/db status=404 remote_addr=127.0.0.1 time_ms=30 size=54 referer=

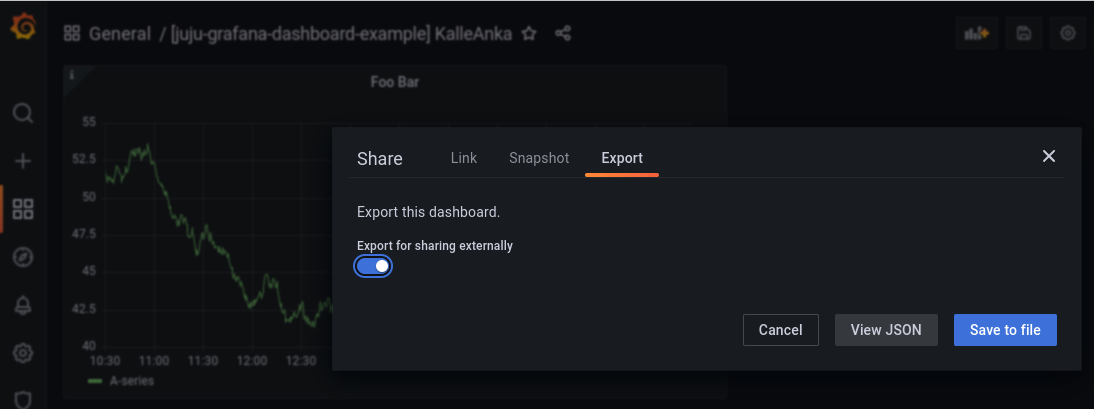
[Update:] Properly exporting matters:

So, one of the issues was that my dashboard.json file had to be exported in the correct way from grafana as the image shows below:

  • Export for sharing externally.

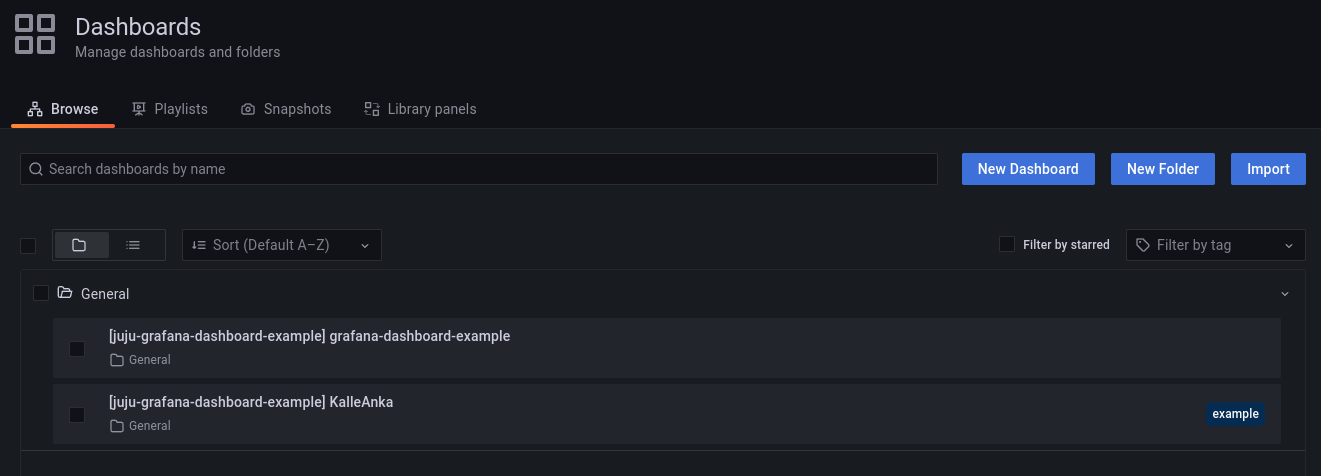
However, when doing so - grafana still (with my current code) imports two separate dashboards (?). One is containing just a default dashboard, but my own now finally makes its way in there aswell. So, my problem is reduced to getting rid of the default one as shown below. (The “KalleAnka” is the one which I provide, the other is coming from somewhere else.)

@tmihoc @cory_fu would it be possible to update documentation for how others needs to work with this interface as it currently doesn’t have any implementation assistance for “ops” at all. The only guides/example code that exists are for “reactive”. I’m happy to provide updates to this post which would in the end be possible to share for more people trying to interface with grafana.

Just to let you know, Cory has left Canonical so probably won’t be in a position to respond to charm questions posted here.

Oh, OK, well - possibly someone who has implemented the ceph-charm could help me understand what I’m doing wrong atm. I’ll try to find out since I’m still getting two dashboards where there should be just one.

As per Deploy Ceph Osd using Charmhub - The Open Operator Collection, I think the @openstack-charmers could maybe help here.

1 Like

It would be great. I can see they are doing something more than just sending the dashboard, but I don’t understand the reason for it - so it would help for sure understanding it and if it in there somewhere the problem occurs.

Does Mark Willson someone you know as he and Cory are the only 2 contributors to the reactive interface currently in place.

@wallyworld - I’ve studied now also the code for the LXD charm which does exactly what I want to do and I see a lot of “hacks” in the code to make it work with the grafana-dashboard which is - to say the least - non trivial to figure out as a charmer.

https://github.com/canonical/charm-lxd/blob/350bdf0a8faaa93db06bb618e97ef8301259be49/src/charm.py#L691

It involves sleeping, inline-patching of the dashboard and none of it is mentioned or covered at all in any documentation for this interface. What can we do to fix this?

I’m happy to provide my charm as a reference once I’ve got it to work, but yeah… Its kind of difficult since the code isn’t straight forward at all as you can see in my link above.

I’ve not done anything in this area myself. There is a grafana charm library, not sure if that’s what you’re after

@wallyworld I seemed to be able to find some help over in the linuxcontainers.org

https://discuss.linuxcontainers.org/t/lxd-charm-new-implementation-operator-framework/11529/44

1 Like

So, I’ve got some kind of working example here: https://github.com/erik78se/juju-operators-examples/tree/main/grafana-dashboard-example

But there are issues still with something makes a duplicate dashboard appearing in grafana and also I’m not sure this will survive cross model relations which I think is very important.

Any way, I was hoping to get a discussion going on the implementation of this charm as an example for other charmers that might try this at home.

So, pulling in [Simon Deziel] (https://discuss.linuxcontainers.org/u/sdeziel) into this thread to continue from here.

Also pinging in @joakimnyman

Hi Erik,

Here’s what I got:

I followed your instructions but related prometheus2 and grafana before injecting the dashboard:

juju relate prometheus:grafana-source grafana:grafana-source

This avoids problem with missing datasource. I also altered the injected JSON like this:

$ diff -Naur /tmp/t1.json /tmp/t2.json 
--- /tmp/t1.json	2022-04-12 16:45:53.205522554 -0400
+++ /tmp/t2.json	2022-04-12 16:39:44.320909588 -0400
@@ -20,7 +20,7 @@
     {
       "type": "datasource",
       "id": "prometheus",
-      "name": "Prometheus",
+      "name": "prometheus - Juju generated source",
       "version": "1.0.0"
     },
     {
@@ -34,7 +34,7 @@
     "list": [
       {
         "builtIn": 1,
-        "datasource": "-- Grafana --",
+        "datasource": "prometheus - Juju generated source",
         "enable": true,
         "hide": true,
         "iconColor": "rgba(0, 211, 255, 1)",

HTH, Simon

1 Like

So you don’t get the extra empty dashboard?

I get two dashboards when I do this, one empty and one correct…

@erik-lonroth I want to clarify something: are you certain that the “extra” dashboard appeared after you related your charm? E.g., are you certain that it’s not just an example dashboard shipped with grafana?

If not, I wonder if the relation handlers are adding the empty dashboard on relation-joined, or another hook where the charm doesn’t quite have all the info that it needs yet.

1 Like

This reminds me that charm-lxd doesn’t use the relation-joined hook but the relation-changed one. I vaguely remember seeing dup/bogus dashboards too which might be why I switched hooks?

Thats what I thought too, but it didn’t change the outcome…

@aluria @sdeziel I still have this issue and I can’t figure out why this happens.

Any chance you can have a look at it? The charm builds and deploys which should make the process of reproducing this easy…

Any help here would be very helpful as this is kind of the final bit before this charm can be used as a training example for beginners.