
The Opentelemetry Collector K8s operator charms the vendor agnostic Opentelemtry Collector (hereafter referred to as Otelcol) which offers a vendor-agnostic implementation on how to receive, process and export telemetry data. It can be considered an equivalent to Grafana Agent by Grafana Labs. Grafana Agent, however, is being deprecated in favour of Alloy.
Using Otelcol, you can collect telemetry such as logs, traces, and metrics from different workloads and subsequently forward to the appropriate backend storage system (e.g. Loki, Tempo, Mimir/Prometheus, etc). Since Otelcol will be replacing Grafana Agent, it is valuable to have an understanding if its data ingestion limits. For this purpose, we will be going through a load testing journey with the help of K6.
The goals of this work are to:
- Determine the maximum volume of logs Opentelemetry Collector is able to take in without slowing performance down or down-time.
- Determine the extent to which the sending queue impacts the volume of telemetry Otelcol is able to transfer. Also, by default, the sending queue holds 1,000 units of telemetry. It would be interesting to see whether that is a “good” default for our purposes or not.
- Along similar lines as (2), we need to also determine how what impact the batch processor has on the performance of Otelcol.
Requirements
To reproduce this work, you would need the following:
- Opentelemetry Collector K8s, revision 69
- Loki monolithic, revision 203
- Canonical K8s v1.33.4
- Juju 3.6.9
- K6 v1.2.1 with the xk6/faker extension v0.4.4 (read here if you’re interested in installing K6 extensions).
Some important concepts
Throughout the rest of this post, you may come across K6 specific lingo. Let’s clear some of it up before we proceed:
- VUs: virtual users are an emulation of a user performing your script. Each virtual user is essentially a concurrent component running your load test script.
- Executors: in the world of Grafana K6, executors control how K6 schedules VUs and iterations. There are approximately seven executors, each suitable for a different set of goals for your simulation.
Initial experiments and K6 setup using an isolated Otelcol
We start out with a simple K6 script which randomizes the length of a single log between 256 and 2048 characters. Then, we use xk6/faker to generate a Lorem Ipsum sentence. The generated log body will then look something like:
Veniam dolorum consequatur eius quia.
Blanditiis error fugiat debitis ut.
Dignissimos alias voluptatum quaerat debitis.
Qui quae perspiciatis fugit sit. Laudantium explicabo tenetur hic quod. ....
Let’s do an initial experiment to get a feel for K6. We’ll do this initial experiment using the constant VUs executor. With this executor, we can specify the number of VUs and the duration of the test and K6 will attempt to carry out as many requests as possible. This means that K6 will send a request and as soon as that request is completed, it will send another one. See the snippet below:
export const options = {
  scenarios: {
    custom_vu_test: {
      executor: "constant-vus",
      vus: 3,
      duration: "10m",
    },
  },
  thresholds: {
    errors: ["rate<0.01"],
    request_duration: ["p(99)<100"],
  },
  discardResponseBodies: true,
};
The workload being load tested is a single unit of the Otelcol K8s charm. Requests from K6 will send logs to port 4318 of Otelcol which is the default OTLP port over HTTP. Since this charm is isolated and not related to a log storage backend (such as Loki), logs received by Otelcol will be written to STDOUT using the debug exporter. Let’s start with a 4cpu8gb machine and see where we go from there. The Otelcol charm itself has been constrained to 2cpu4gb, which is reasonable for a collector.
The objective here is to get a feel for the maximum number of log lines per minute that Otelcol can ingest while passing the following thresholds:
- 99% of responses returned by Otelcol should have status code 200. This means that for the duration of the load test, Otelcol should be generally available and up.
- The 99th percentile of the requests should take less than 100 milliseconds to be complete.
On that note, let’s also confirm whether continuing the tests on a
4cpu8gbmachine is a good idea. We should also settle on the number of logs we want each request to contain. We’ll run the test for 10 minutes. The result looks as below:
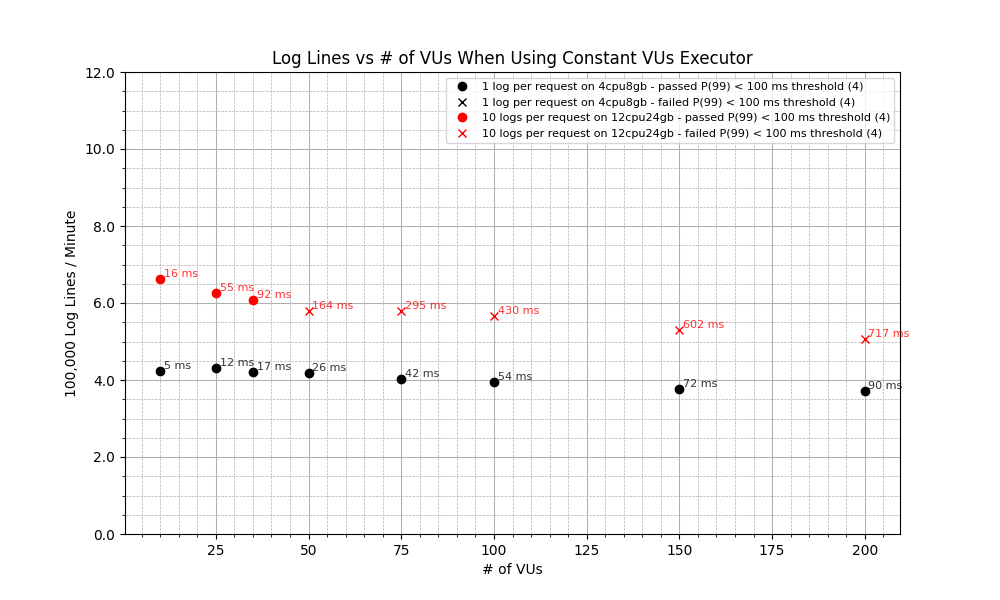
Not a bad start! We have alternated between different numbers of VUs and logs per request and seen that as the number of VUs increases, the 99th percentile of responses becomes slower and slower and at around 75 VUs, we start to go over the 100 ms threshold. More importantly, Otelcol was able to take in a maximum of 660,000 log lines per minute in the best case scenario, which is a significantly high number! There are, however, some important takeaways here:
- Going forward, let’s take the middle ground between 1 and 10 logs per request. We’ll stick to 5 logs per request from now on.
- Throughout the 10 minute test duration, all four CPU cores were at or above 95% utility. Since both K6 and Otelcol were on the same machine, this suggests that either of them could have been starved of resources which may have negatively impacted their performance. For future tests, we’ll use a host of
12cpu24gb. We can keep the collector constrained to2cpu4gb.
Let’s put our improvements to a quick test. We’ll try again with 5 logs per request on two different machines: one of 4cpu8gb and one of 12cpu24gb. The results speak for themselves:
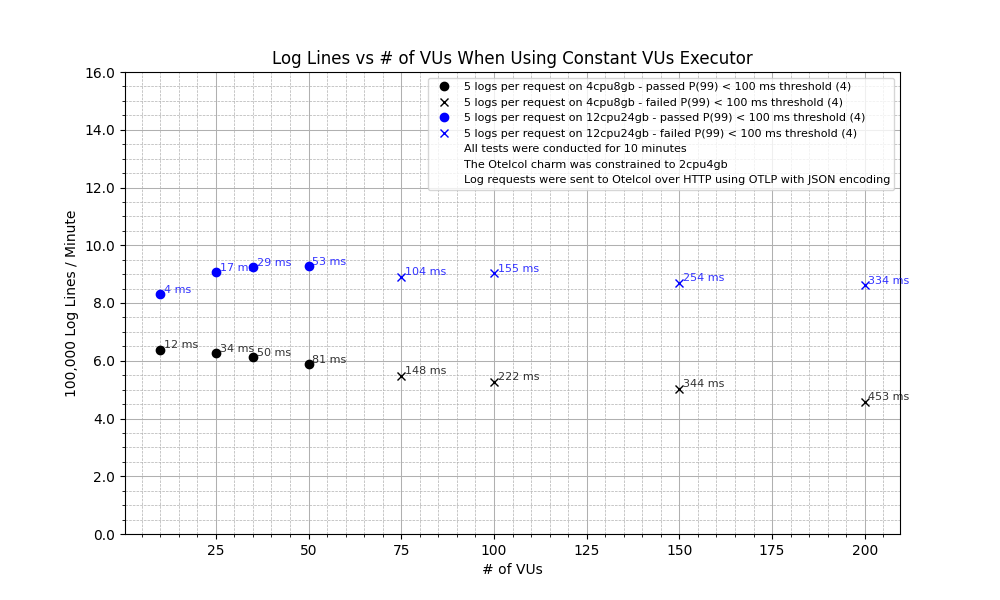
We have now managed Otelcol to ingest close to 950,000 logs per minute with an average latency of 53 ms.
Now that we have made some improvements to our initial script, let’s do some serious load testing! So far we have worked only with Otelcol in isolation. In reality, however, having a collector in isolation is often no use! A collector receives telemetry, processes it, and then exports it to an aggregation or storage system. You’ll notice that this pipeline introduces some interesting concepts we can look at:
- The sending queue is part of the exporter part of the pipeline. It is a buffer that temporarily holds telemetry data.
- The batch processor groups telemetry data into batches before passing it to the next component (usually an exporter). This improves performance by reducing the number of outgoing calls and making more efficient use of network and CPU resources.
Our focus in the next section is to understand how queuing and batching impact the performance of Otelcol. We’ll look at CPU and memory use, error rate, and response latency to understand this.
Load testing Otelcol with a Loki stand-in
Since our focus is on logs, we will eventually have to collect telemetry using Otelcol and then send it to Loki. Before we do that though, let’s deploy another Otelcol which will represent Loki (for now at least). Now, we have two Otelcols deployed on K8s, one of them will be the subject of the load test; it will collect telemetry from K6, process it, and then forward it to the second Otelcol (AKA the Loki stand-in) which acts as our log storage solution.
Sending queue
We’ll first check the performance of Otelcol with different queue sizes. From now on, we’ll use the constant arrival rate executor and try different values of log lines per minute. Our K6 config now looks like:
export const options = {
  scenarios: {
    constant_rate_test: {
      executor: "constant-arrival-rate",
      rate: 2,000, // iterations per time unit minute - default is 1s (5 logs per iteration)
      timeUnit: "1m",
      duration: "10m",
      preAllocatedVUs: 200,
      maxVUs: 300,
    },
  },
  thresholds: {
    errors: ["rate<0.1"],
    request_duration: ["p(99)<100"],
  },
  discardResponseBodies: true,
};
Throughout the load test, we will monitor the CPU and memory use of the Otelcol pod.
Similarly, we’ll also look at how the error rate changes for different log lines per minute.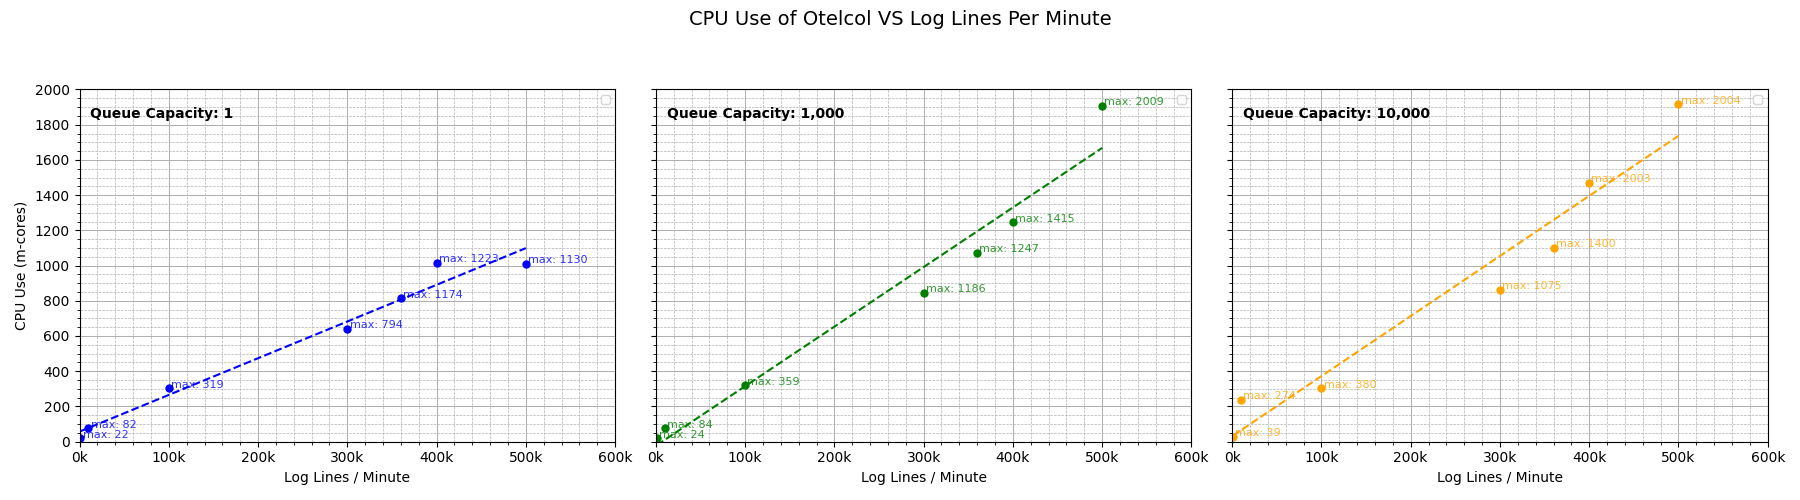
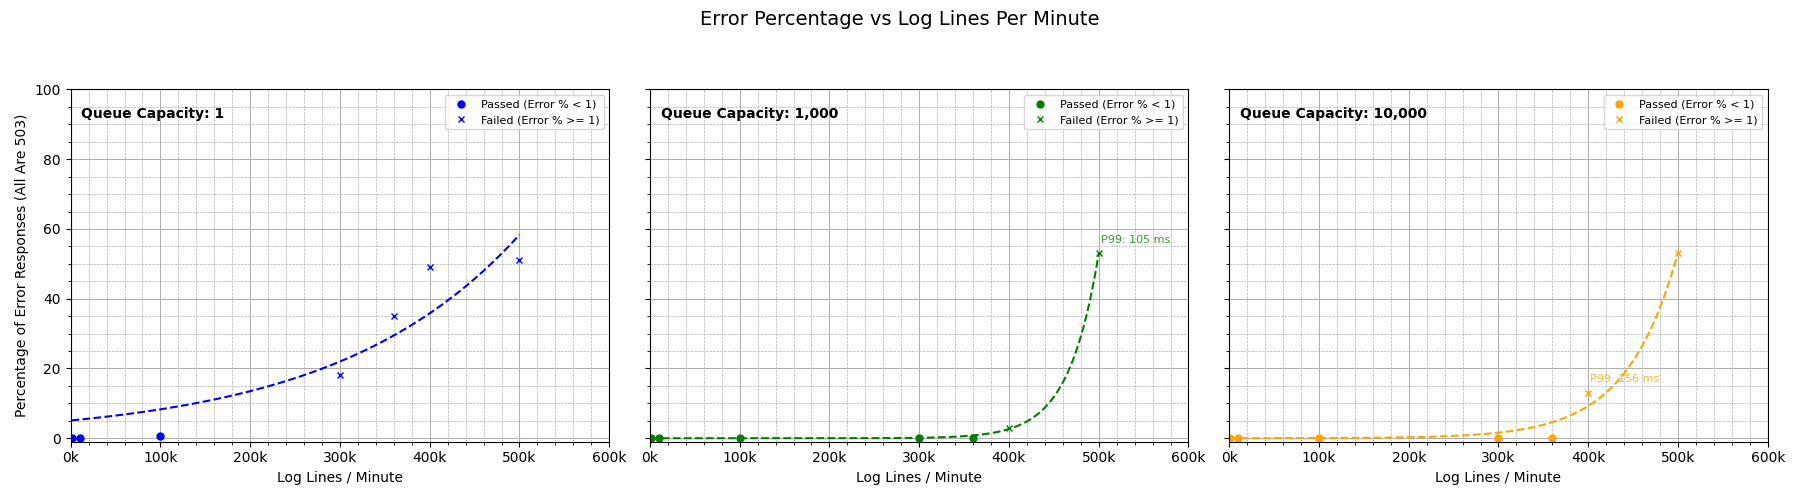
As the graphs tell us, the queue of 1,000 is working as expected and performance within the reasonable range of 100K to 200K logs per minute is generally acceptable, both in terms of resource usage and up-time. We have ascertained that a queue size of 1,000 works like a charm (pun intended)!
Batch processor
For testing purposes, we will configure a batch processor like:
batch:
    timeout: 5s
    send_batch_size: 1024
    send_batch_max_size: 2048
This config says:
Group telemetry data into batches of up to 1024 items. If 5 seconds pass and we don’t hit that number, send whatever we have. If, due to a spike, more than 2048 items are ready, cap the batch at 2048 and send it.
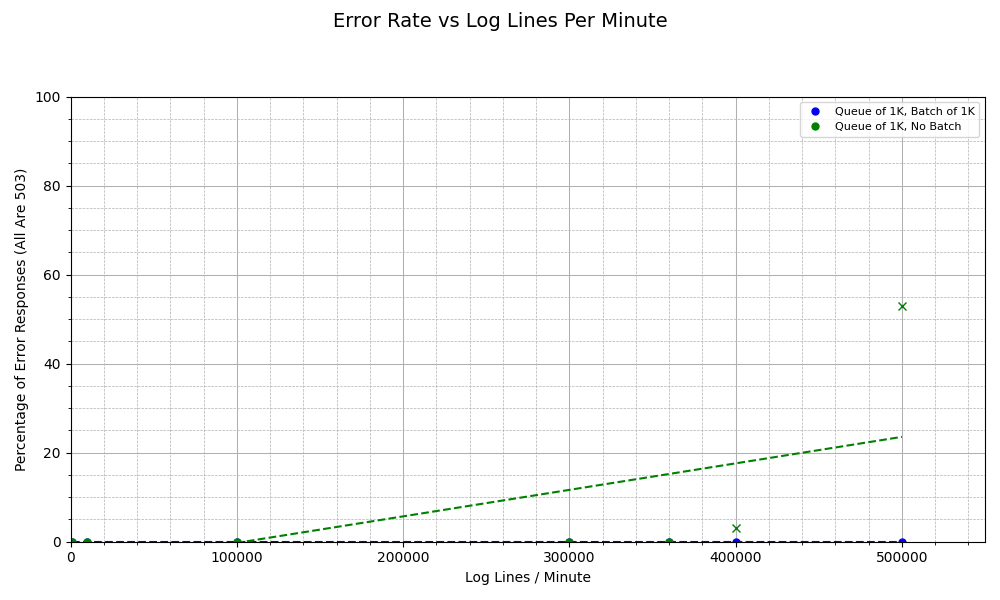
We can now repeat our load test using this batch processor (with a sending queue of 1,000) and compare it to the scenario where we only had a sending queue of 1,000.
The graph below shows the CPU use in the two scenarios across different levels of logs per minute.
Interesting plot! Since we are using batches, the OpenTelemetry Collector sends data in larger, grouped chunks rather than individual items. This significantly reduces the number of outgoing requests made to the backend, which in turn lowers the overhead associated with network I/O, connection handling, and serialization. But wait: since we are keeping data in batches and then sending them to queue, this means we are holding more telemetry inside Otelcol at all times. How does the memory use change? Aha! The overhead of the batch processor goes to memory. Across all values of log lines per minute, we consume twice the level of memory when batching compared to when we aren’t. This highlights a trade-off: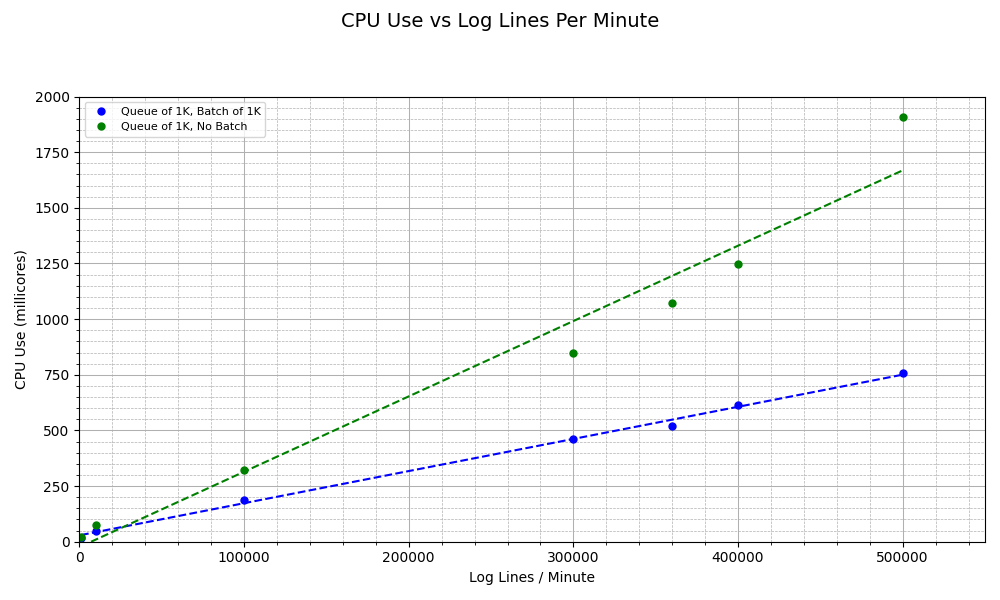

The batch processor comes with less CPU but more memory overhead.
Most importantly, when batching, we get no errors from Otelcol. This can be due to the fact that since batching leads to less resource usage, Otelcol has more processing available to respond to the relatively high level of requests coming in from K6. Thus, we avoid a denial-of-service scenario by reducing required processing power through batching.
Otelcol and Loki
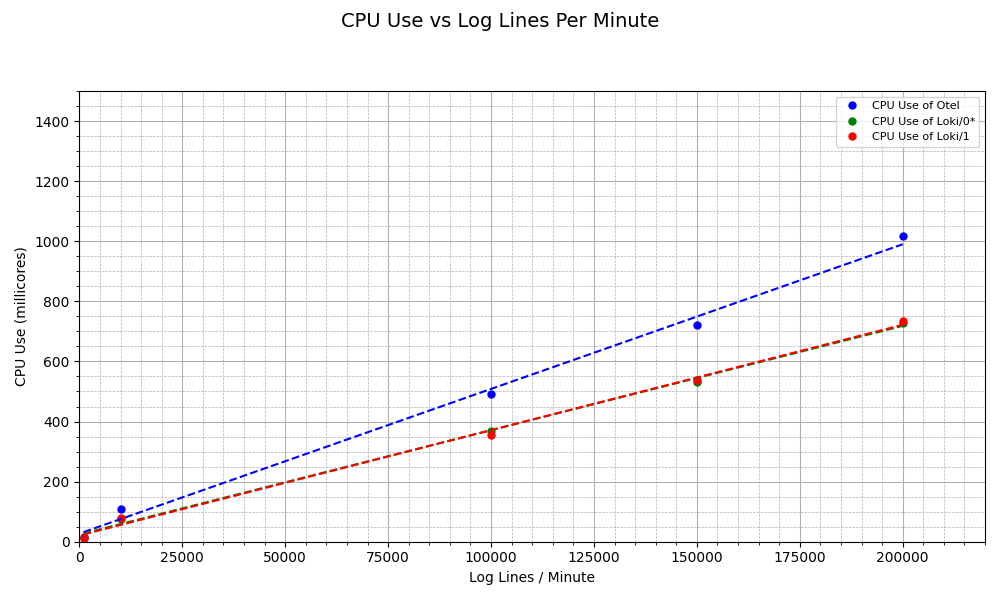
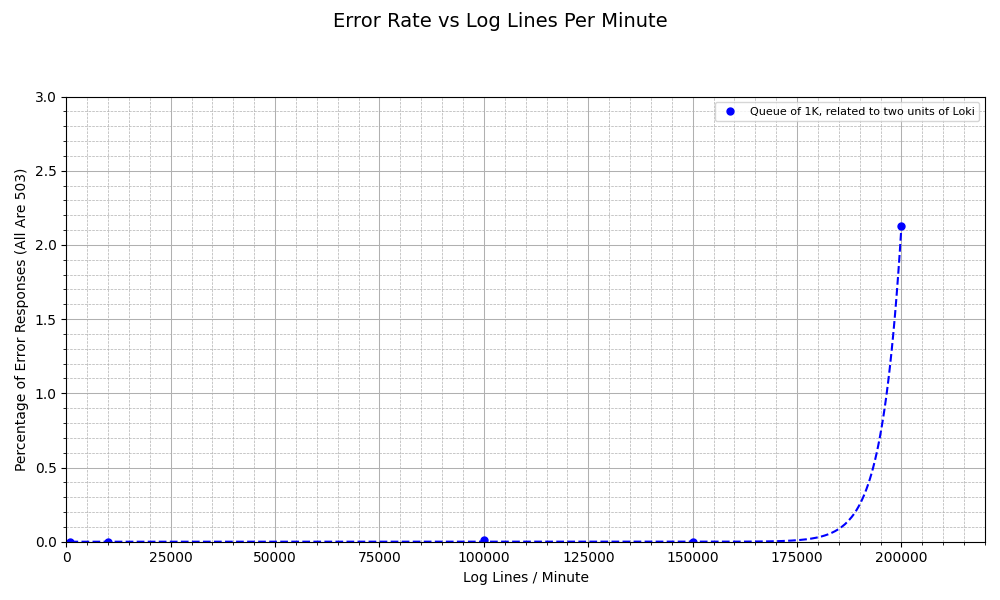
Now that we have (somewhat) mastered K6, confirmed the benefits of the queue and batch processor, and managed to get relatively high levels of log through Opentelemetry Collector, let’s now try and see how much load Opentelemetry Collector can handle when it’s related to two units of Loki over TLS. A quick note that Loki has a constraint of 4cpu8gb.
Once again, we look at CPU and memory use across different pods.
Conclusion
- The sending queue is a beneficial component using which we can reduce error rate. A default queue of 1,000 should be sufficient even when Otelcol is receiving higher than average loads.
- The use of the batch processor can reduce down-time in Otelcol and also relieve some processing load off the Collector.
- When related to Loki, Otelcol can ingest as high as 200,000 logs per minute at low error rates.
Future work
- It would be interesting to repeat similar experiments as those in this work with traces and metrics and compare the performance in those cases