Hi,
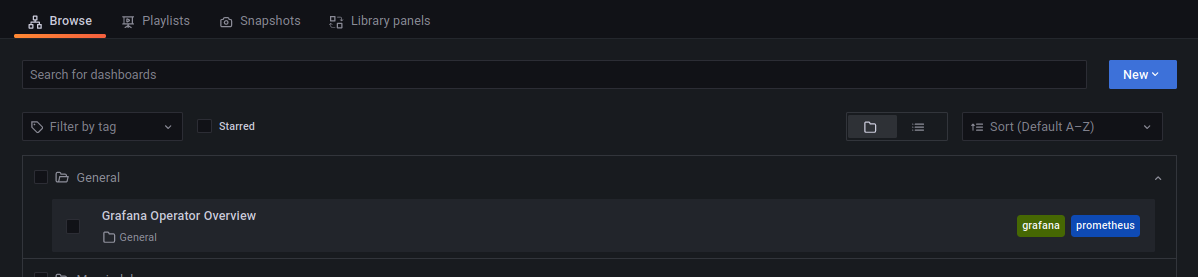
We are continuously tinkering with the COS-stack and grafana-agent. One thing I noticed is that dashboards sent from grafana-agent doesn’t reappear in grafana after the computer has been of for a couple of days. Even though the relation is still maintained.
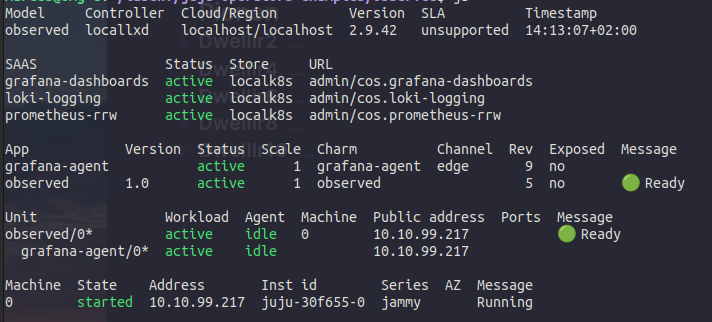
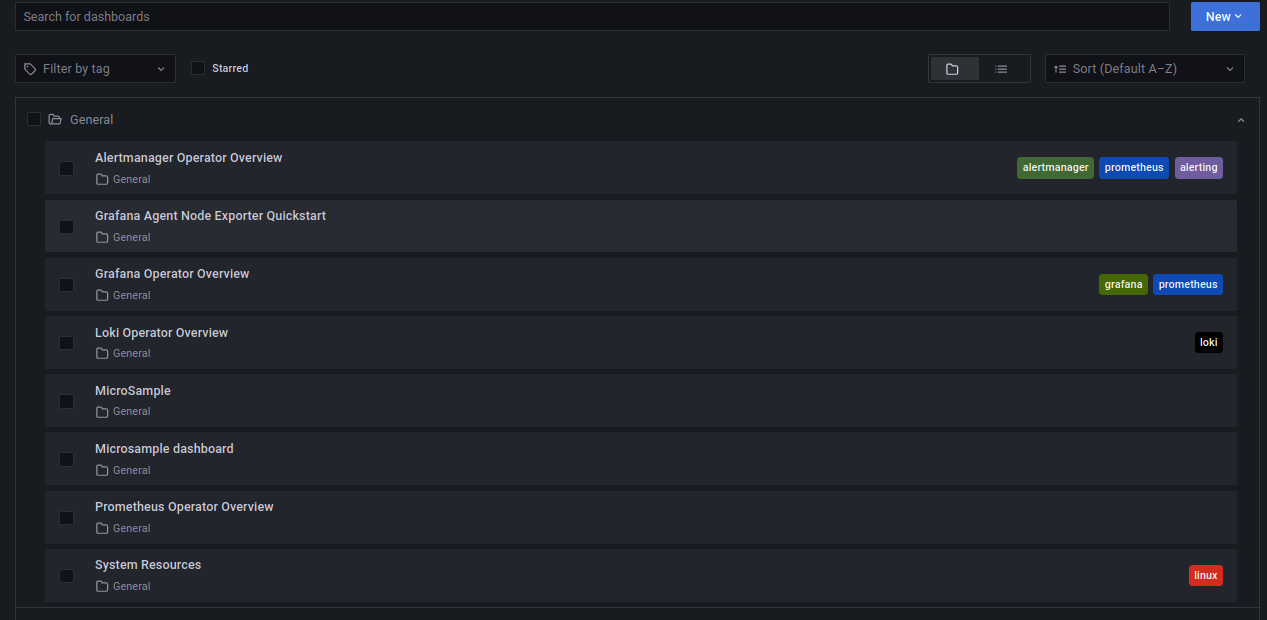
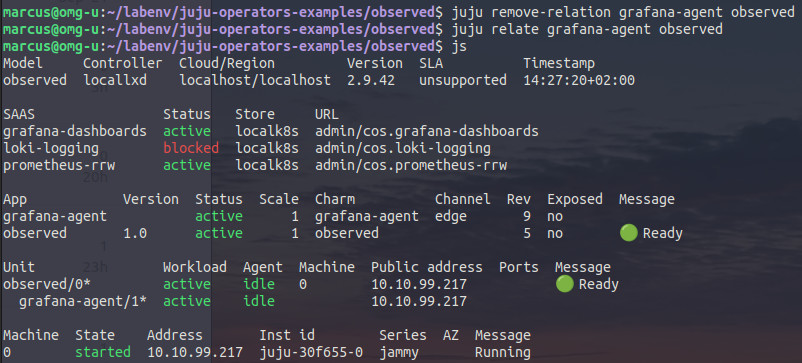
We are just completing work exploring COS lite by implementing a reference charm like I showed you in other threads and @marcus just managed to get loki alert rules in there now.
The final piece(s) of this puzzle for us is to understand how we can:
integrate with some alerting or ticketing service, such as pagerduty or/and Zammad
Add tls to be able to expose the service on internet.
From there, we should be about brave enough to go into production.
This is also complete enough to be foundation for the promised community workshop we plan to host. Deploying the complete stack.
There are however some rough edges we fear, but possibly can live with and work with you guy to get stable.
I’m thinking out loud, but Alertmanager is able to send notifications using webhooks and, as far as I understand, you can connect it with PagerDuty
Traefik (COS-Lite ingress) implements the requires side of the interface tls-certificates. The provider side of this relation is implemented in 4 different charms. Maybe you can use one of these.