
The OpenTelemetry Collector distribution from the Observability Team
The Observability Team is working hard to replace Grafana Agent, which has been deprecated. To do this, we have begun to familiarise ourselves with an open source project that is set to become the benchmark in observability: OpenTelemetry.
One of the great things about OpenTelemetry Collector is that it has several distributions that we can use, but in our case, none of them fully met the needs of the Observability Team. The smallest distribution, otelcol, is missing some things, and the others have many more things that we will never use.
So, thanks to the architecture chosen by OpenTelemetry, we started to make our own “distribution”" of OpenTelemetry Collector. Calling it a distribution may sound pretentious, but it is nothing more and nothing less than that: We took the base components used in the minimal otelcol distribution and added the contrib components we needed. This way, we can obtain the smallest possible version of OpenTelemetry Collector that meets our requirements.
One of the components we add to our OpenTelemetry Collector distribution is lokireceiver, which, as its name suggests, is capable of receiving logs in Loki format. Although sooner rather than later we will stop using this component in favour of the OTLP standard, for the moment it is a critical component as there are many charms that send their logs using this protocol.
 Everything is happiness, until it isn’t.
A few days ago, while working on the Terraform module for COS to replace Grafana Agent with OpenTelemetry Collector, we noticed something strange: if we used OpenTelemetry Collector, the logs from the COS components didn’t reach Loki! I won’t deny that our first reaction was one of perplexity. How could the charm we had been working so hard on be “broken”"? Could it be that we had implemented some of its relationships incorrectly? Or worse still, had we forgotten to implement it altogether?
 Mate-driven debugging
After a couple of minutes of staring at the screen without understanding what was happening, I decided to get up from my desk, take a deep breath, and prepare some mate[1] to start debugging the error.
Debugging why the logs are not reaching Loki in a COS deployment can be a bit chaotic, as there are more than 20 applications, with, in some cases, several units for each one. So I decided to start narrowing down the problem.
I created an empty model with the bare minimum:
- flog to generate logs
- OpenTelemetry Collector to receive those logs
- Grafana to visualise the logs
- Traefik to access the deployment from another network.
With all these charms deployed and related, it was now time to open Grafana, see that the logs were not reaching Loki, and then start to understand which part was failing. Could it be a poorly generated configuration that was preventing the logs from reaching Loki? ![]() I think so… it’s most likely.
I think so… it’s most likely.
So we open Grafana to check that the logs are not reaching Lo…
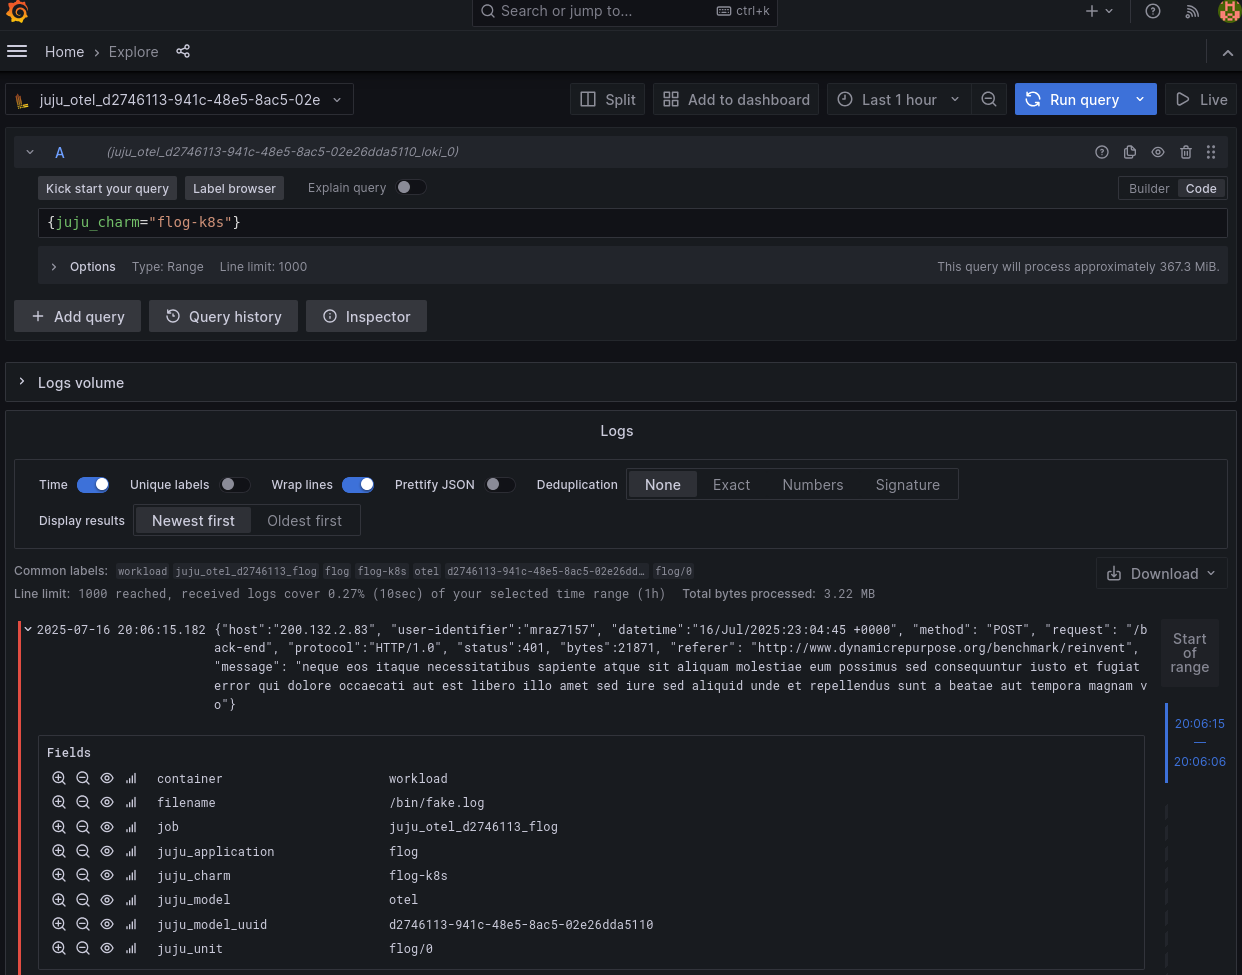
…ki.
Well, now I was really confused. There were logs, forwarded by OpenTelemetry Collector and coming from flog, in Loki. I don’t know if you’ve ever had that feeling that good news (OpenTelemetry Collector was working) is discouraging. And it’s discouraging because now I was even more lost than before. The simple test I was trying didn’t reproduce the error, and there’s no way to fix an error if we can’t reproduce it.
Maybe I wasn’t drinking enough mate to understand the problem, so without thinking, I went to the kitchen to make myself some more mate.
As I filled the kettle with water, it suddenly dawned on me that in our charms we have two ways to send logs:
The first one we implemented is LogProxyConsumer, an object within the library provided by the Loki charm that downloads and configures Promtail in the workload container.
The second way that Kubernetes charms can send logs is LogForwarder. This object, which is also part of the Loki library, sends logs using the Pebble log forwarding mechanism.
Could it be that flog sends logs differently from the other charms that are part of COS?
The answer is YES! flog uses LogProxyConsumer and all our charms that are part of COS use the newest LogForwarder that uses a Pebble feature to send logs.
The only thing left to do now was to deploy a simple charm that uses LogForwarder and verify that the logs were not arriving. So, the charm chosen for this second test was Parca. A couple of minutes later, I was able to verify that there were no Parca logs in Loki.
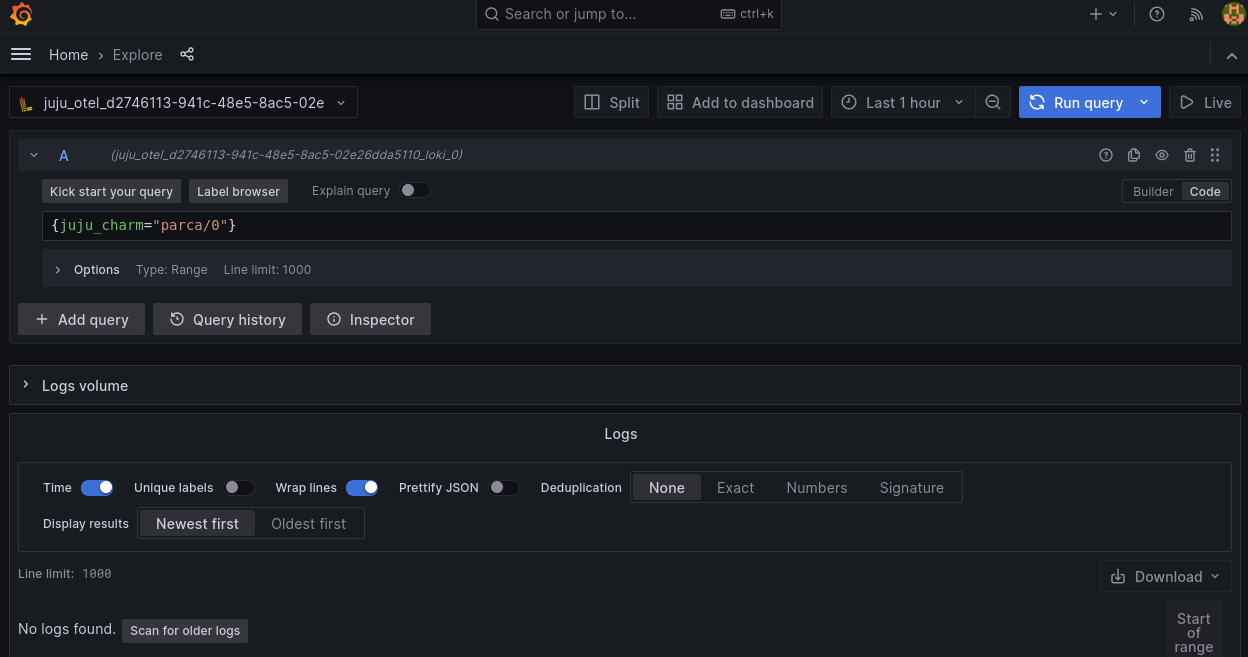
Excellent, case closed! I had found the culprit: it was Pebble. @benhoyt and his team will surely be more than happy to fix this bug that completely broke COS.
But there was something that didn’t quite add up for me, and my mate needed to be renewed so I could continue to reflect deeply[2]. After all, the only thing that had changed in the original COS deployment was grafana-agent to otelcol. What makes otelcol different that in one case it forwards logs and in another case it doesn’t?
 The rabbit hole
This error won’t resolve itself; we have to go find it wherever it’s hiding.
One thing was clear: the logs from charms sent using LogForwarder weren’t reaching Loki if they first passed through otelcol instead of grafana-agent, so the error wasn’t on the charms side. It had to be in otelcol. If this is true, the logs have to reach otelcol, but for some reason otelcol is not forwarding them to Loki.
Let’s start at the beginning and see what reaches otelcol using a tool as old as it is effective: tcpdump:
root@otelcol-0:/# tcpdump -i any port 3500 -mm -A

tcpdump: ignoring option `-m m' (no libsmi support)
tcpdump: data link type LINUX_SLL2
tcpdump: verbose output suppressed, use -v[v]... for full protocol decode
listening on any, link-type LINUX_SLL2 (Linux cooked v2), snapshot length 262144 bytes

21:13:05.676690 eth0  In  IP parca-0.parca-endpoints.otel.svc.cluster.local.36752 > otelcol-0.otelcol-endpoints.otel.svc.cluster.local.3500: Flags [P.], seq 3691806750:3691807330, ack 966134725, win 8649, options [nop,nop,TS val 3894151061 ecr 686675194], length 580
E..x..@.?./.
...
...........9.....!.e......
....(...POST /loki/api/v1/push HTTP/1.1
Host: otelcol-0.otelcol-endpoints.otel.svc.cluster.local:3500
User-Agent: pebble/v1.19.0
Content-Length: 363
Content-Type: application/json; charset=utf-8
Accept-Encoding: gzip

{"streams":[{"stream":{"charm":"parca-k8s","juju_application":"parca","juju_model":"otel","juju_model_uuid":"d2746113-941c-48e5-8ac5-02e26dda5110","juju_unit":"parca/0","pebble_service":"nginx","product":"Juju"},"values":[["1752700384675000000","10.1.167.153 - - [16/Jul/2025:21:13:04 +0000] \"GET /debug/pprof/allocs HTTP/1.1\" 200 50818 \"-\" \"conprof/\""]]}]}
21:13:05.676873 eth0  Out IP otelcol-0.otelcol-endpoints.otel.svc.cluster.local.3500 > parca-0.parca-endpoints.otel.svc.cluster.local.36752: Flags [P.], seq 1:204, ack 580, win 456, options [nop,nop,TS val 686678228 ecr 3894151061], length 203
E.....@.@.%.
...
.......9......b....dH.....
(.......HTTP/1.1 415 Unsupported Media Type
Content-Type: text/plain
Date: Wed, 16 Jul 2025 21:13:05 GMT
Content-Length: 81

415 unsupported media type, supported: [application/json, application/x-protobuf]
21:13:05.676908 eth0  In  IP parca-0.parca-endpoints.otel.svc.cluster.local.36752 > otelcol-0.otelcol-endpoints.otel.svc.cluster.local.3500: Flags [.], ack 204, win 8671, options [nop,nop,TS val 3894151061 ecr 686678228], length 0
E..4..@.?.1.
...
..........b9.....!.c}.....
....(...
What we see there is a request and a response, which provide us with extremely valuable information:
-
Parca is indeed sending its logs in
jsonformat:{"streams":[{"stream":{"charm":"parca-k8s","juju_application":"parca","juju_model":"otel","juju_model_uuid":"d2746113-941c-48e5-8ac5-02e26dda5110","juju_unit":"parca/0","pebble_service":"nginx","product":"Juju"},"values":[["1752700384675000000","10.1.167.153 - - [16/Jul/2025:21:13:04 +0000] \"GET /debug/pprof/allocs HTTP/1.1\" 200 50818 \"-\" \"conprof/\""]]}]} -
Two lines before that, we see that the request header has the
Content-Typecorrectly set, sending JSON in UTF-8:Content-Type: application/json; charset=utf-8 -
A couple of lines further down, we see the response, and something catches our attention. Why would the return code be
415?415 unsupported media type, supported: [application/json, application/x-protobuf]
Additionally, that message says that the only supported media types are [application/json, application/x-protobuf]. This is really strange! As we saw earlier, the request made by Pebble has application/json correctly set in its header. Something is rotten in the state of Denmark this rabbit hole.
At the beginning of this story, I told you that one of the add-ons we added to our otelcol distribution is lokireceiver. So off I went in search of the rabbit. After spending some time searching, I found the line of code that prints that message:
func handleUnmatchedContentType(resp http.ResponseWriter) {
	status := http.StatusUnsupportedMediaType
	writeResponse(resp, "text/plain", status, []byte(fmt.Sprintf("%v unsupported media type, supported: [%s, %s]", status, jsonContentType, pbContentType)))
}
We are so close! Where else could the function be called from? The answer came a couple of minutes later in the loki.go file, specifically in the method that creates the lokireceiver instance. There I found the error, in a harmless switch...case:
switch req.Header.Get("Content-Type") {
case jsonContentType, pbContentType:
	handleLogs(resp, req, r)
default:
	handleUnmatchedContentType(resp)
}
That code snippet obtains the Content-Type field from the request header, which in our case Pebble sets (in accordance with RFC9110) as application/json; charset=utf-8 and compares it directly with the value of the jsonContentType constant defined a couple of lines above as simply application/json:
const (
	pbContentType   = "application/x-protobuf"
	jsonContentType = "application/json"
)
Eureka! There’s the error! lokireceiver is comparing the Content-Type literally.
Now that we know what the error is, all that remains is to:
- Open an issue in the OpenTelemetry Collector contrib repo
- Create a PR with the fix.

 Some final thoughts
-
As they say in an epic scene from “The Eternaut”: Lo viejo funciona! (The old stuff works!).
tcpdumpis a command line tool that is over 30 years old and was essential for understanding what was happening. Just because tools are “old” does not mean they are obsolete. -
But, why our integration tests pass in
opentelemetry-collector-k8scharm? Because we use
 flogcharm that usesPromtailto send logs… and Promtail creates aprotobufrequest with this header:Content-Type: application/x-protobuf. There is an opportunity to improve our test coverage by sending logs injsonformat too. Issue created for this. -
The basis of everything we do on a daily basis is Open Source. Can you imagine how frustrating our work would be if we couldn’t understand how the tools we use work and couldn’t collaborate with their maintainers on these small improvements?
Argentines don’t drink mate because we’re thirsty. There are thousands of reasons why we drink mate, one of which is when we need to think or reflect on an important situation in our lives, such as whether it’s worth confessing our love to that university classmate we like so much, or simply thinking about how to fix an error in a system. ↩︎
I understand that you, reading these lines, may feel that mate is more than just a traditional South American drink, but rather a kind of drug that alters the faculties of those who consume it. In our defence, I will only say that no one has ever stopped me at airport security for carrying mate in my luggage
 ↩︎
↩︎