
When developing or debugging a charm, it is often a struggle to wrap one’s head around event emission sequences. What events fire exactly when a unit starts? When a pod churns? When a machine reboots? When you relate two applications?
juju debug-log offers all the information you need, but not in the friendliest format. To visualize event emission in real time, we developed jhack tail, a utility to track events being emitted in a model as they happen.
Setup
To follow this tutorial you’ll need to:
-
Grab
jhack tail:- You can install it from sources
- or you can grab the (dev! might be buggy) snap

-
Setup a testing model
- We create a model
foowithjuju add-model foo - We configure the logging level to debug for units:
juju model-config logging-config="<root>=WARNING;unit=DEBUG", otherwise events will not be logged.
- We create a model
-
deploy two applications that can integrate, such as
traefik-k8sandprometheus-k8s:-
juju deploy traefik-k8s --channel beta --revision 10 trfk- configure traefik:
juju config trfk external_hostname=foo.com
- configure traefik:
juju deploy prometheus-k8s --channel beta prom
-
At this point your model should look like this:
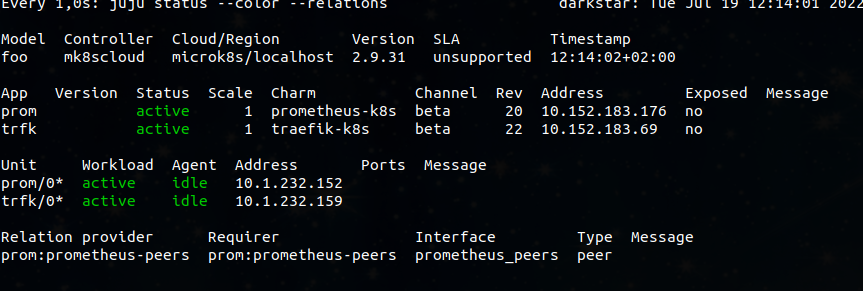
Note: you can also try this with any other application or any other juju deployment (public clouds, etc…).
From log to tail
juju debug-log, once you configure the model to log units at DEBUG level, will show some logs emitted by juju, some emitted by OF, and some by the charms you deployed in the model. Here we are interested in event-related logs.
In a nutshell, jhack tail runs juju debug-log, scans for event emission/deferral/reemission logs and pretty-prints some essential information about them in a tabular format.
If you take a look at juju debug-log --replay | grep Emitting, you will see a few logs that recorded when the startup sequence was emitted on the two units as they came up, and the config-changed event emitted when we configured traefik.
Now let’s have a look at them through jhack tail:
Executing jhack tail will display:
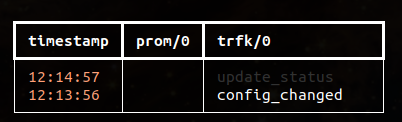
Like juju debug-log, this shows only the most recent events by default. If you want to see all events, from the beginning of this model’s lifetime, you have to add a --replay flag.
Executing jhack tail --replay will display:
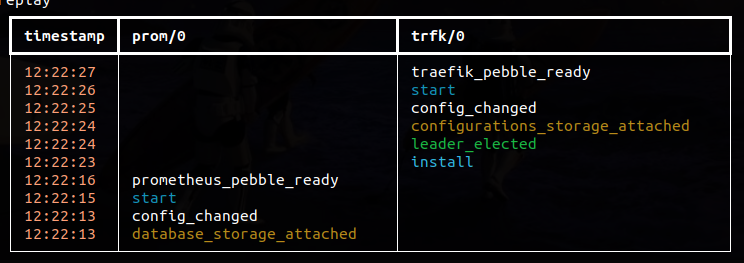
These are all the events that the units have seen so far.
jhack tail will, by default, continue tailing the log and remain alive until you kill it with ctrl+c.
Exploring event sequences
Scaling up applications
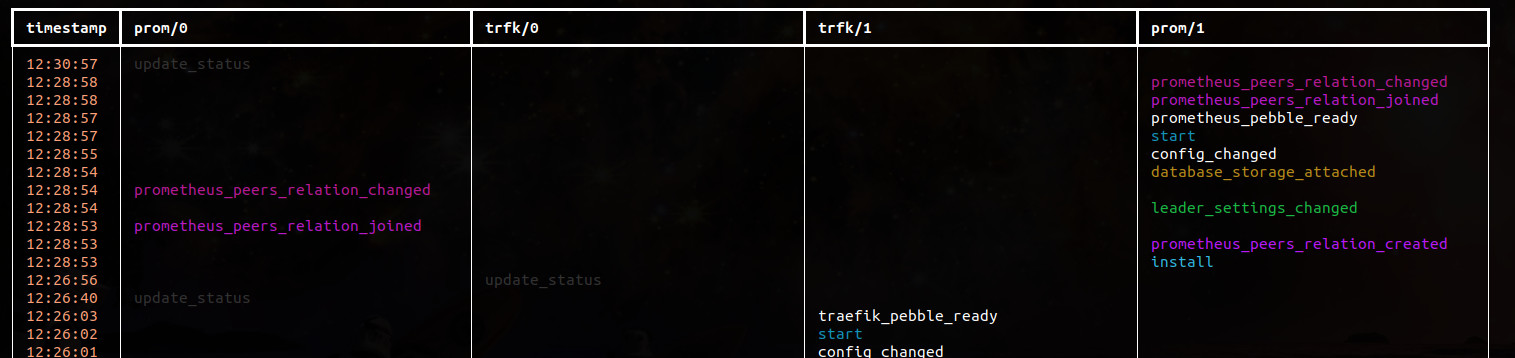
jhack tail is useful for verifying event sequences in real time, and follow the execution order of code blocks in your charm. For example, you can scale traefik up with juju add-unit trfk -n 1 and sit back and enjoy while jhack tail adds a column to the table displaying the newly added unit:
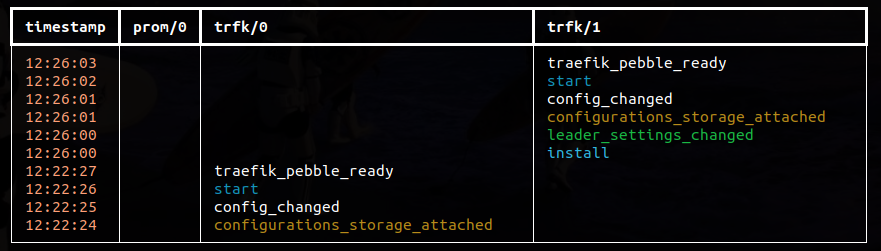
You’ll notice that the prom/0 column is empty now; that is because by default jhack tail only shows the most recent 10 events in the log. You can pass a different number with --length to change that default. For example: jhack tail --replay --length 30
This wasn’t too interesting because traefik has no peer relations, therefore the units don’t trigger events off one another. Let’s scale prometheus up to see that in action:
juju add-unit prom -n 1
Now jhack tail will show that prometheus-peers-relation-joined gets fired on both prom/0 and prom/1 at different moments.
This is starting to get a bit cluttered, so let’s clean it up:
You can pass a list of ‘targets’ to jhack tail, which essentially map to juju debug-log --include X.
Execute jhack tail --replay --length 30 prom:
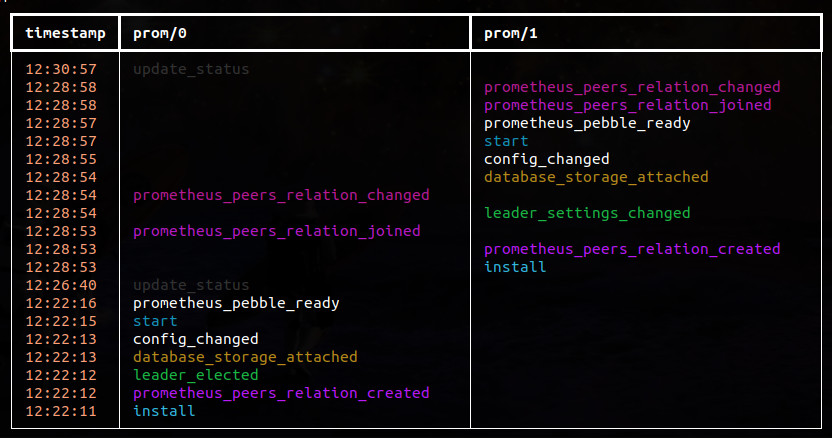
That’s nicer.
Relating applications
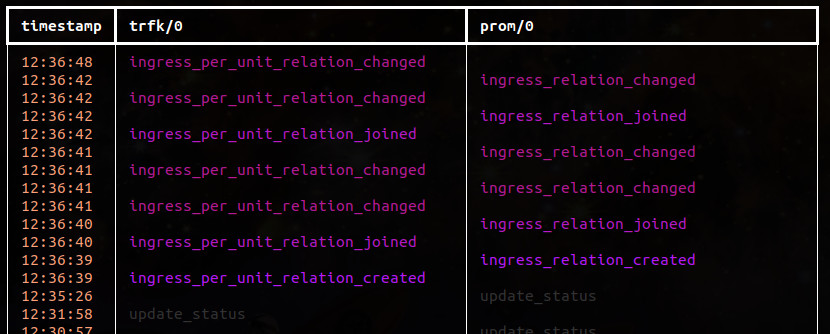
Similarly, jhack tail can nicely show what happens when you relate two applications.
Let’s execute jhack tail --replay --length 30 "prom/0;trfk/0" and then in another terminal: juju relate trfk prom:ingress.
You can pass multiple targets to jhack tail as semicolon-separated strings.
You should see:
Exploring event.defer() behaviour
It is often a struggle for beginners to understand (and for veterans to remember) what exactly happens when an event gets deferred. And if an event gets re-deferred, and another event gets also deferred before the first one is reemitted and eventually consumed, and so on and so forth. It can get labyrinthic.
And so we added a --show-defer flag, that will show the deferral status of events.
Execute jhack tail --replay --length 30 --show-defer "prom/0;trfk/0"
For spending so much time in front of a keyboard, we really dislike typing, so most of those flags and options have shortcuts: the above command can be written as: jhack tail -rdl 30 "prom/0;trfk/0"
You will see that the output does not differ at all from the one we got without --show-defer. The reason is that, at least with these two charms, no events got deferred!
So let’s change that.
Warning: things might get hacky from here on.
juju ssh trfk/0 bash
# apt update; apt install vim
# vim ./agents/unit-trfk-0/charm/src/charm.py
Go down to line 158, in _on_update_status. Rename the anonymous _ argument to event, and just below self._process_status_and_configurations(), add the following:
import random
if random.random() < 0.5:
    return event.defer()
Save and exit.
This will do nothing in terms of charm behaviour, but it will make the --show-defer output more interesting for this little demo.
End hacky section.
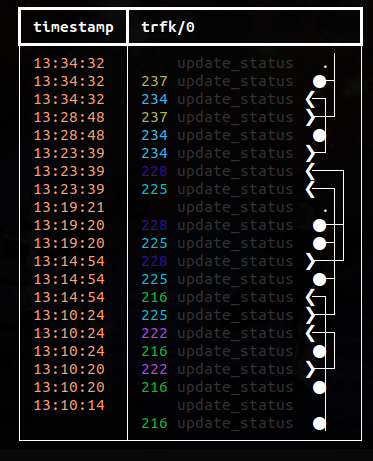
Execute jhack tail --replay --length 30 --show-defer "prom/0;trfk/0" again;
Since update-status events are by default pretty slow, we can add some tempo by:
juju model-config update-status-hook-interval=5s.
We do this often, reason why there’s also jhack ffwd that does that better 
Now you should see a column appear with some fancy arrows and links
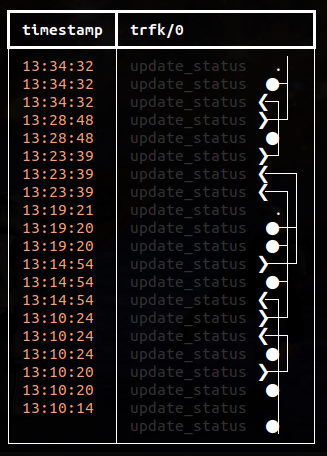
It looks complicated, but it is actually quite simple:
- ❯means: the event has been emitted and deferred.
- ❮ means: the event has been consumed (i.e. emitted, but not deferred)
- ● means: the event, which had previously been emitted and deferred, has been reemitted and immediately re-deferred.
Since the example we have written is random, we’ll see some complicated hieroglyphs here. In most typical scenarios, one would hope this would be less complicated.
The Operator Framework attaches to each deferred event a numerical ID that we can use to match events being reemitted to ones being deferred, so that we can be sure that it’s “the same event”. That is the number which
jhack tailuses to figure out which of the Nupdate-statusevents currently being deferred is being reemitted right now, and so on.If you add the
--show-defer-idflag, you can make them visible:
Pro tip
Did you know about jhack fire/replay?
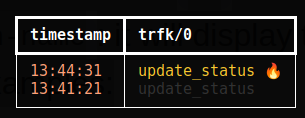
jhack tail is well integrated with both of them, and will display differently events that have been fired by other jhack commands.
Conclusion
We have seen how we can use jhack tail to view events being fired on a number of applications in real time, and follow them as they get deferred, re-emitted, and interleave with other events being fired on other units.
Have fun!