I’m trying to understand how a good working process looks like for integrating with grafana-agent juju libs and COS. Its getting promising and I’ll write up my experiences down the road.
I have an example charm which I’ve got to work largely, but I’m stuck at the moment with how I should work with grafana dashboards.
My initial question (I have a few more) is why I seem to get duplicated values for my single-value metrics from the prometheus datasource coming from the COS integrations.
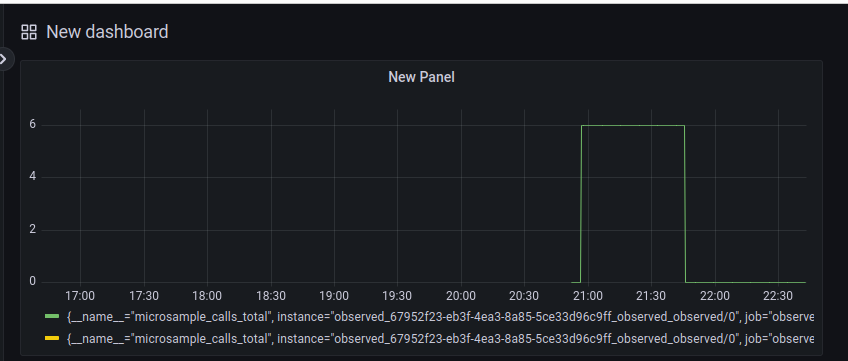
Below is my situation where there are two series where I would like only one:
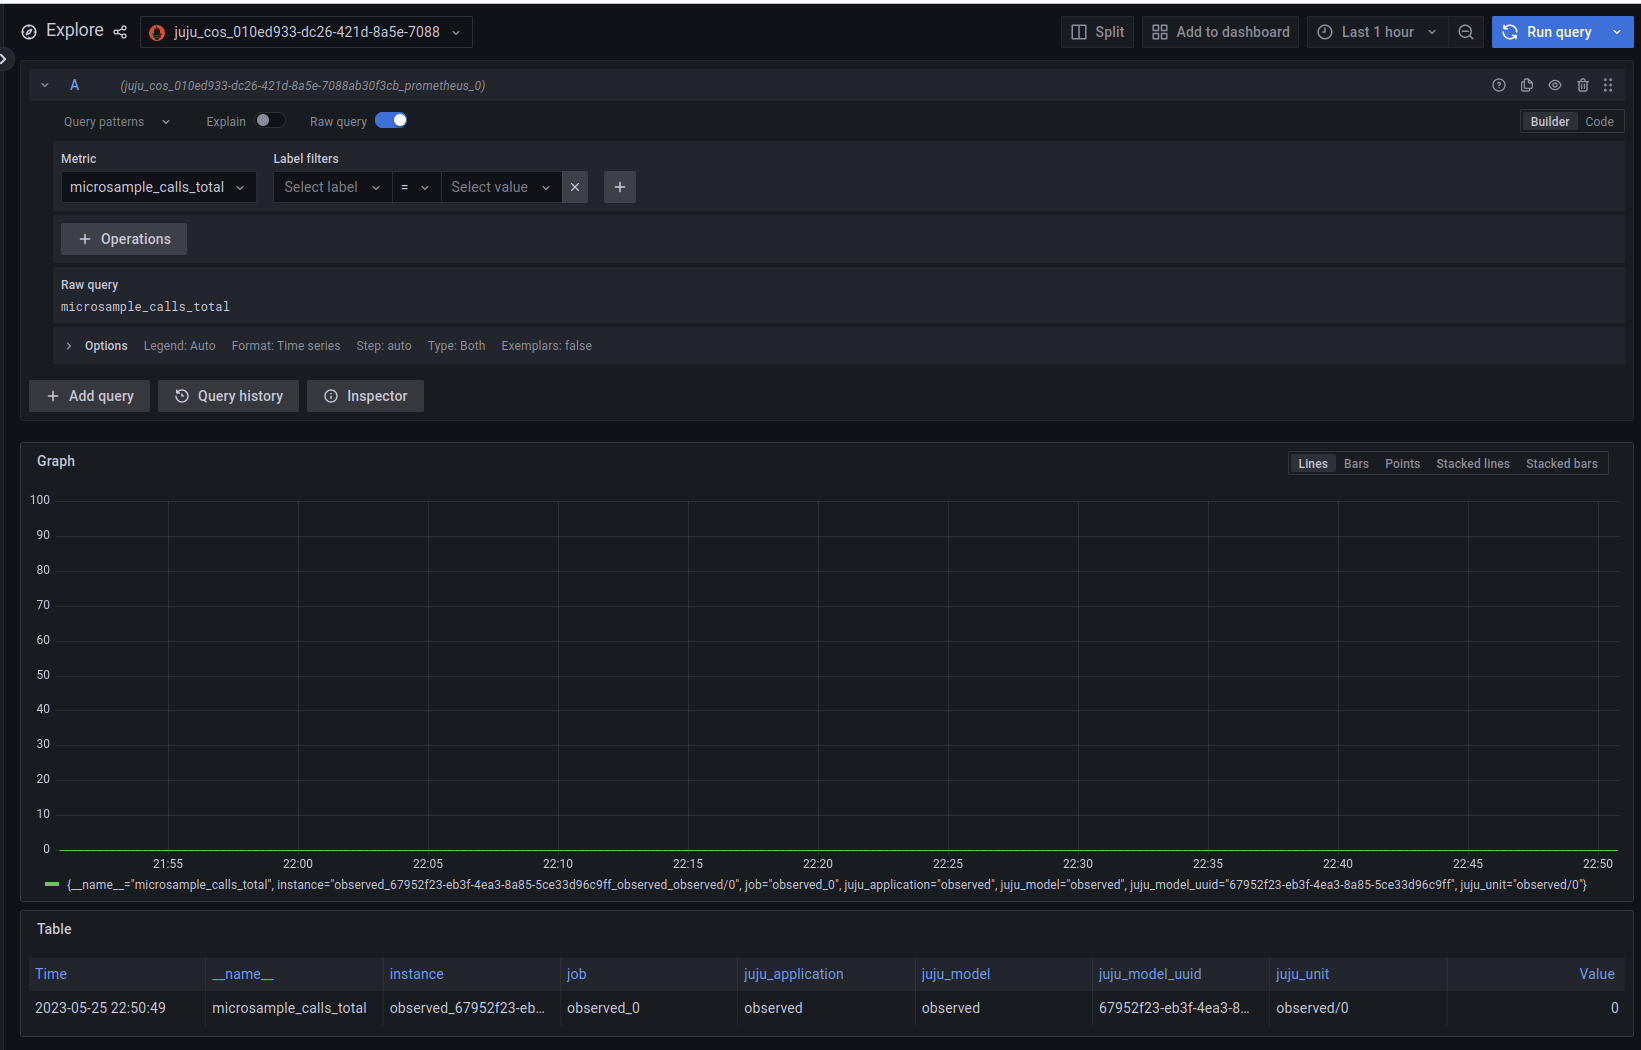
Would you mind showing the configuration of the panel where you get the duplicates? Ie. the PromQL query and any other configuration you’ve made of the panel.
This looks reasonable to me. Unless the query returns two time series it shouldn’t create two lines in the graph. Mind copying the full series name from the legend? What I’m mainly interested in is if any of the labels differ between the green and yellow one.
I’ve deployed the same setup on my local lab and played around a bit.
The reason why you’re seeing two time series is because you have the query type set to Both, meaning it will do both a range query and an instant query. If you only want one time series, pick the one that you think makes the most sense for your metric.
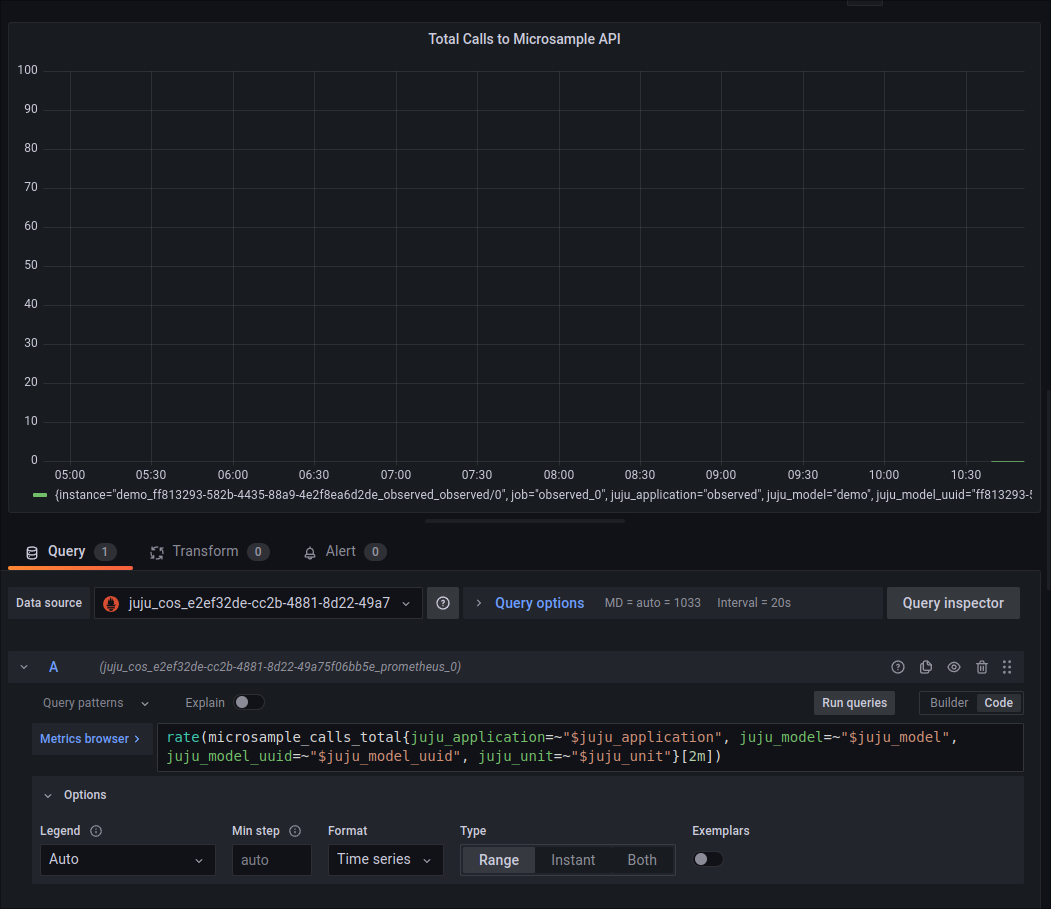
As a side note, the metric you’ve picked is a counter (as indicated by the _total suffix), meaning that unless you want it to just be a monotonically increasing graph, you’d need to apply some function like rate or difference to it so that you instead get some kind of delta value. Likely something along the lines of what is attached below: