The Opentelemetry-collector (Otelcol) can be a bit of a black box ![]() with its pipeline components: receiving, processing, and exporting. When we want to do some rapid R&D on Otelcol, the charming layer is too complex, so we can simplify to be more efficient! In this example, we want to check the message format that Otelcol sends to Loki.
with its pipeline components: receiving, processing, and exporting. When we want to do some rapid R&D on Otelcol, the charming layer is too complex, so we can simplify to be more efficient! In this example, we want to check the message format that Otelcol sends to Loki.

Setup
.
├── config.yaml
├── create-logs.sh
└── fake-log.json
- Create an Otelcol config.yaml
- Update
YOUR_DIRto be the result ofecho $PWD
- Update
- Download the binary release v0.121.0 (or later)
- Create the log file (and a log line) by running:
echo "{\"time\": \"$(date '+%Y-%m-%d %H:%M:%S')\", \"level\": \"info\", \"message\": \"Log message\"}" >> fake-log.json
Deploy
- Deploy the Loki charm (in a k8s Juju controller)
juju add-model loki && juju deploy loki-k8s loki --trust- Update
LOKI_IPin the Otelcolconfig.yamlusingjuju status
- Start Otelcol with the
config.yamlotelcol-contrib --config $(pwd)/config.yaml
Your Otelcol logs should include:
2025-03-21T08:34:40.504-0400    info    lokiexporter@v0.120.1/exporter.go:43    using the new Loki exporter    {"otelcol.component.id": "loki", "otelcol.component.kind": "Exporter", "otelcol.signal": "logs"}
2025-03-21T08:34:40.709-0400    info    fileconsumer/file.go:265        Started watching file   {"otelcol.component.id": "filelog", "otelcol.component.kind": "Receiver", "otelcol.signal": "logs", "component": "fileconsumer", "path": "YOUR_DIR/fake-log.json"}
There are no Errors in the Otelcol logs, and we can see that the filelog receiver and loki exporter are configured.
Test
- Create another log line with the script
./create-logs.sh
- See the log structure in the Otelcol logs:
2025-03-21T08:39:13.445-0400	info	ResourceLog #0
Resource SchemaURL:
Resource attributes:
     -> service.name: Str(loki)
ScopeLogs #0
ScopeLogs SchemaURL:
InstrumentationScope
LogRecord #0
ObservedTimestamp: 2025-03-21 12:39:13.344658221 +0000 UTC
Timestamp: 2025-03-21 12:39:13 +0000 UTC
SeverityText:
SeverityNumber: Unspecified(0)
Body: Str({"time": "2025-03-21 08:39:13", "level": "info", "message": "Log message"})
Attributes:
     -> log.file.name: Str(test.json)
     -> time: Str(2025-03-21 08:39:13)
     -> level: Str(info)
     -> message: Str(Log message)
Trace ID:
Span ID:
Flags: 0
	{"otelcol.component.id": "debug", "otelcol.component.kind": "Exporter", "otelcol.signal": "logs"}
Note: Logs are batched and contain 2 sections: ResourceLog and LogRecord defined in the log schema.
Summary
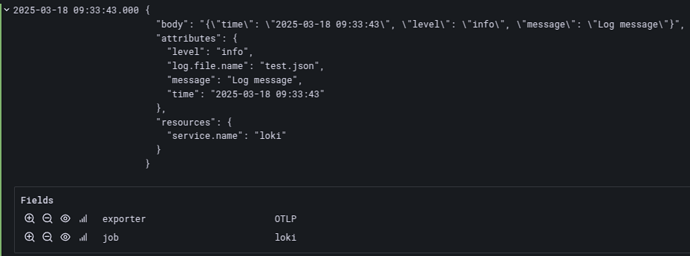
We can inspect the log format received from the file by Otelcol before being sent to Loki. The loki exporter can be further configured for control over indexed labels, but will expose the configured default_labels_enabled: exporter, job, instance, level.
We can use these labels to find and inspect the logs in the Grafana UI for Loki logs being forwarded by Otelcol:
References
- Native OTLP vs. Loki exporter
- Pipeline component docs (check out their README as well!):
- Grafana docs - Otelcol advanced setup
- Loki exporter doesn’t support structured metadata
- Otelcol charm feat: logging
