
One of the goals for COS Lite is to be able to ingest considerable amount of data on modest hardware. Load testing is useful for gaining insight into how to size observability clusters appropriately.
Method
- No resource limits set (for now).
- MicroK8s 1.24, Juju 2.9.34.
- Loki workload version was pinned to 2.4.1 (reason).
- The latest results were obtained with the following charm versions:
| App | Version | Charm | Channel | Rev |
|---|---|---|---|---|
| alertmanager | 0.25.0 | alertmanager-k8s | edge | 64 |
| cos-config | 3.5.0 | cos-configuration-k8s | edge | 31 |
| grafana | 9.2.1 | grafana-k8s | edge | 76 |
| loki | 2.4.1 | loki-k8s | edge | 80 |
| prometheus | 2.42.0 | prometheus-k8s | edge | 119 |
| scrape-config | n/a | prometheus-scrape-config-k8s | edge | 39 |
| scrape-target | n/a | prometheus-scrape-target-k8s | edge | 25 |
| traefik | 2.9.6 | traefik-k8s | edge | 124 |
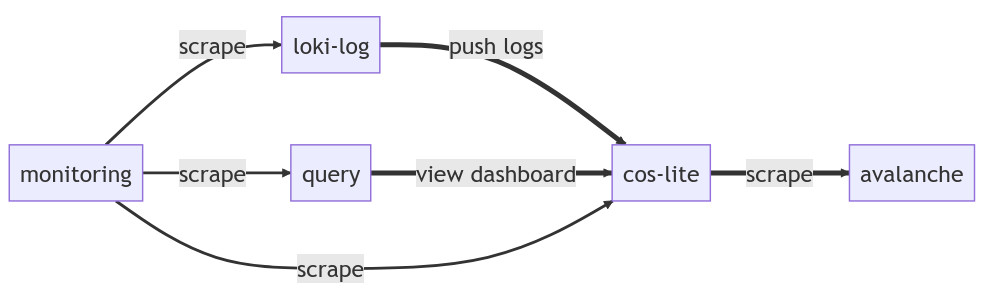
The load test is using terraform to provision:
- COS Lite VM. Deployed from the cos-lite bundle with an overlay dedicated for the load test.
- Avalanche VM. Used as scrape targets for prometheus. The number of targets and the number of metrics per target are adjustable.
- Query VM. Used for “browser testing” with 20 “virtual eyeballs” looking at a grafana dashboard consisting of 600 log lines and 7200 graph points, refreshing every 5 sec.
- Loki log VM. Used for pushing logs to loki from multiple virtual targets (“streams”).
- Monitoring VM. Used for collecting metrics from the load test’s components for monitoring and producing performance data sheets.
Results
| Metrics only | Logs only | Metrics and Logs | |
|---|---|---|---|
| Max scraped data points / min | 1,710,000 | - | 1,200,000 |
| Max ingested log lines / min | - | 180,000 | 135,000 |
| Storage (GB/day) | 4 | 54 | 50 |
Note that the results above do not leave any leeway. For production you should probably add >10% margin.
Discussion
VM resource usage
Load tests that run successfully for over 6h without incidents are marked as “PASSED”, and are used for constructing the datasheet. Passing tests are also used for curve fitting an approximation for resource usage.
In the diagram below:
- Numbers in square boxes represent passing tests.
- Red “X” represent failed tests.
- Gray dashed contours are the resource consumption estimation, based on curve fitting a linear function in two variables (
y = a1 * x1 + a2 * x2 + b) to all the tests. - Some data points appear inconsistent with the trend. This is most likely due to changing conditions from test to test, such as: new charm release, compaction taking place close to recording final test data, or timing alignment of the querying browser instances producing a spike. As charms and juju stabilize, the numbers are expected to be more consistent in future tests.
- Log lines ingestion rate is CPU-limited, and and metrics ingestion rate is memory-limited.

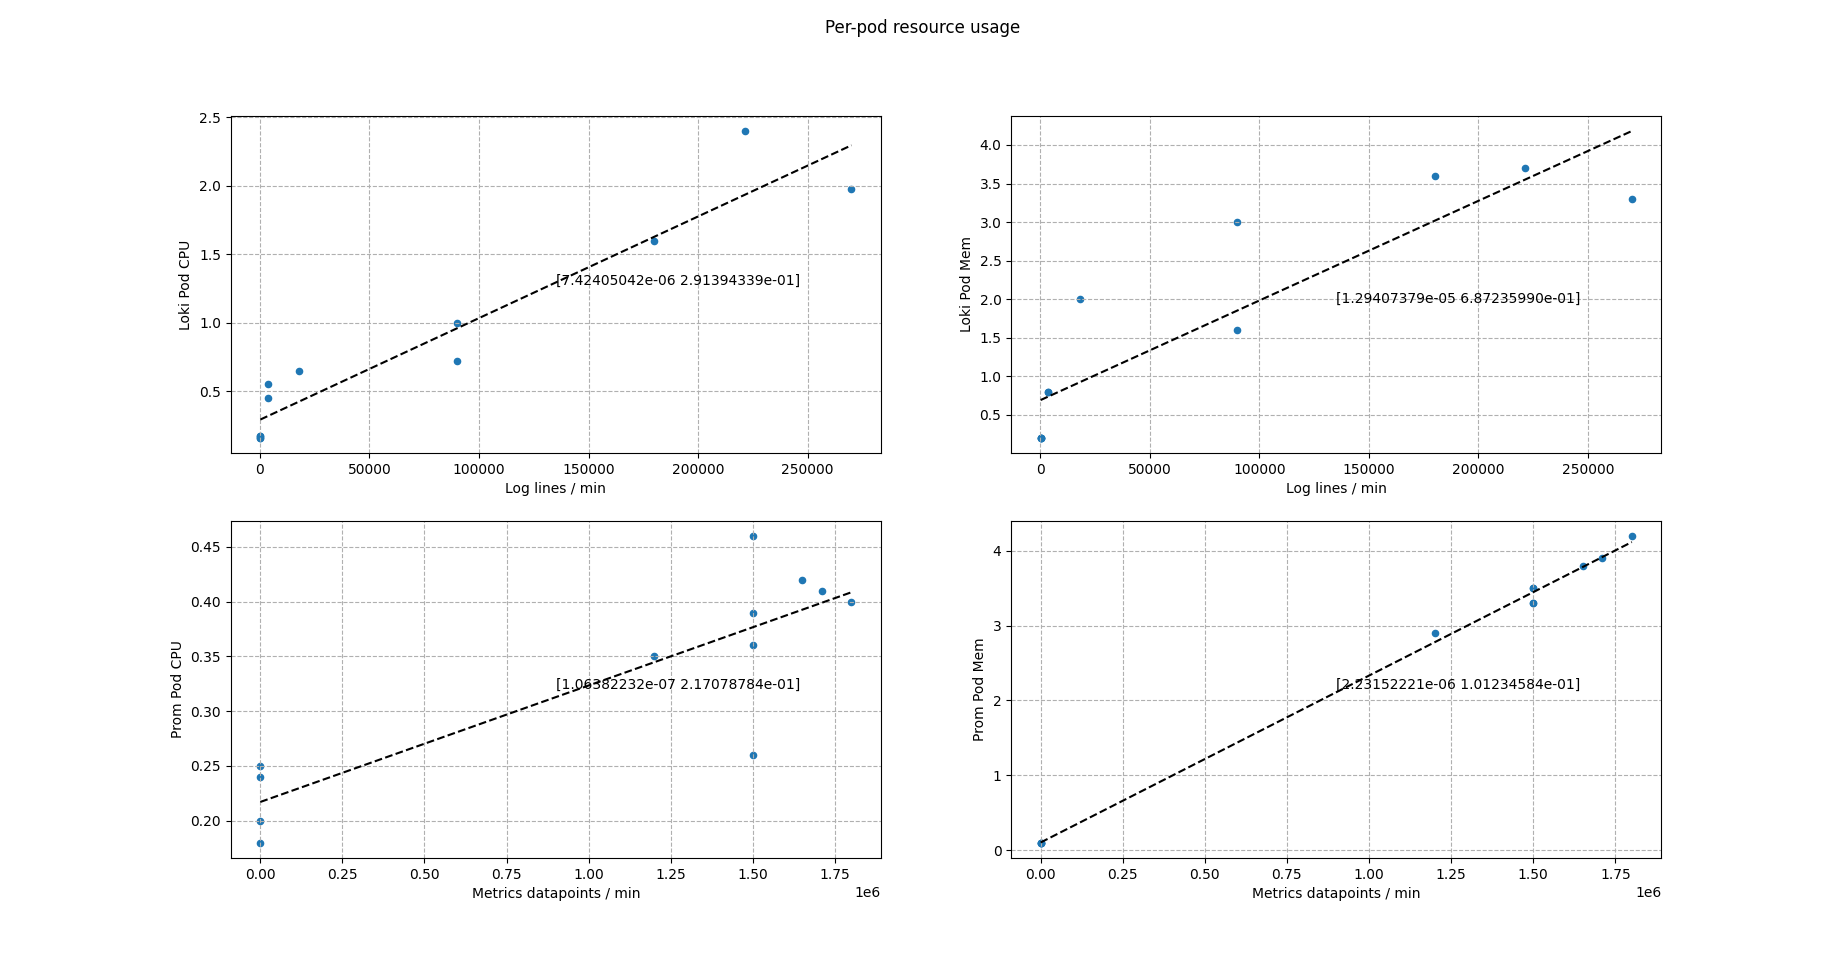
Per-pod resource usage
In addition to the overall VM resource usage, we also look at the cpu and memory usage per pod (reported by kubectl top pod).
- We need 0.8 CPU and 1.4 Gi memory for every 100,000 log lines per minute ingested by Loki.
- We need 0.12 CPU and 2.3 Gi memory for every 1,000,000 metrics datapoints per minute ingested by prometheus.
| Pod | CPU | Memory |
|---|---|---|
| Loki | 0.75 / 100k | 1.3Gi / 100k |
| Prometheus | 0.11 / 1M | 2.3Gi / 1M |
Table: pod resources needed for per-minute ingestion rates.
Conclusions
- The Grafana Labs stack that COS Lite is based on can ingest a substantial amount of data on fairly moderate hardware.
- Being unable to deploy the same charm revisions (workload versions) every single load test run introduced some jitter in the results.
- More load tests are needed to improve the prediction accuracy of the fitted curves.
