
From Zero to Hero: Write your first Kubernetes charm > Observe your charm with COS Lite
See previous: Expose your charm’s operational tasks via actions
This document is part of a series, and we recommend you follow it in sequence. However, you can also jump straight in by checking out the code from the previous branches:
git clone https://github.com/canonical/juju-sdk-tutorial-k8s.git
cd juju-sdk-tutorial-k8s
git checkout 06_create_actions
git checkout -b 07_cos_integration
In a production deployment it is essential to observe and monitor the health of your application. A charm user will want to be able to collect real time metrics and application logs, set up alert rules, and visualise any collected data in a neat form on a dashboard.
Our application is prepared for that – as you might recall, it uses starlette-exporter to generate real-time application metrics and to expose them via a /metrics endpoint that is designed to be scraped by Prometheus. As a charm developer, you’ll want to use that to make your charm observable.
In the charming universe, what you would do is deploy the existing Canonical Observability Stack (COS) lite bundle – a convenient collection of charms that includes all of Prometheus, Loki, and Grafana – and then integrate your charm with Prometheus to collect real-time application metrics; with Loki to collect application logs; and with Grafana to create dashboards and visualise collected data.
In this part of the tutorial we will follow this process to collect various metrics and logs about your application and visualise them on a dashboard.
Contents:
- Integrate with Prometheus
- Integrate with Loki
- Integrate with Grafana
- Specify packages required to build
- Validate your charm
- Review the final code
Integrate with Prometheus
Follow the steps below to make your charm capable of integrating with the existing Prometheus charm. This will enable your charm user to collect real-time metrics about your application.
- Fetch the Prometheus interface libraries
- Define the Prometheus relation interface
- Import the Prometheus interface libraries and set up Prometheus scraping
Fetch the Prometheus interface libraries
Ensure you’re in your Multipass Ubuntu VM, in your charm project directory.
Then, satisfy the interface library requirement of the Prometheus charm by fetching the prometheus_scrape library:
ubuntu@charm-dev:~/fastapi-demo$ charmcraft fetch-lib charms.prometheus_k8s.v0.prometheus_scrape
Also satisfy the dependency requirements of the prometheus_scrape library by fetching the juju_topology library:
ubuntu@charm-dev:~/fastapi-demo$ charmcraft fetch-lib charms.observability_libs.v0.juju_topology
Your charm directory should now include the structure below:
lib
└── charms
    ├── observability_libs
    │   └── v0
    │       └── juju_topology.py
    └── prometheus_k8s
        └── v0
            └── prometheus_scrape.py
Note: When you rebuild your charm with charmcraft pack, Charmcraft will copy the contents of the top lib directory to the project root. Thus, to import this library in your code, use just charms.prometheus_k8s.v0.prometheus_scrape.
Define the Prometheus relation interface
In your charmcraft.yaml file, before the peers block, add a provides endpoint with relation name metrics-endpoint and interface name prometheus_scrape, as below. This declares that your charm can offer services to other charms over the prometheus-scrape interface. In short, that your charm is open to integrations with, for example, the official Prometheus charm. (Note: metrics-endpoint is the default relation name recommended by the prometheus_scrape interface library.)
provides:
  metrics-endpoint:
    interface: prometheus_scrape
Read more:
provides
Import the Prometheus interface libraries and set up Prometheus scraping
In your src/charm.py file, do the following:
First, at the top of the file, import the prometheus_scrape library:
from charms.prometheus_k8s.v0.prometheus_scrape import MetricsEndpointProvider
Now, in your charm’s __init__ method, initialise the MetricsEndpointProvider instance with the desired scrape target, as below. Note that this uses the relation name that you specified earlier in the charmcraft.yaml file. Also, reflecting the fact that you’ve made your charm’s port configurable (see previous chapter Make the charm configurable), the target job is set to be consumed from config. The URL path is not included because it is predictable (defaults to /metrics), so the Prometheus library uses it automatically. The last line, which sets the refresh_event to the config_change event, ensures that the Prometheus charm will change its scraping target every time someone changes the port configuration. Overall, this code will allow your application to be scraped by Prometheus once they’ve been integrated.
self._prometheus_scraping = MetricsEndpointProvider(
    self,
    relation_name="metrics-endpoint",
    jobs=[{"static_configs": [{"targets": [f"*:{self.config['server-port']}"]}]}],
    refresh_event=self.on.config_changed,
)
Congratulations, your charm is ready to be integrated with Prometheus!
Integrate with Loki
Follow the steps below to make your charm capable of integrating with the existing Loki charm. This will enable your charm user to collect application logs.
- Fetch the Loki interface libraries
- Define the Loki relation interface
- Import the Loki interface libraries and set up the Loki API
Fetch the Loki interface libraries
Ensure you’re in your Multipass Ubuntu VM, in your charm folder.
Then, satisfy the interface library requirements of the Loki charm by fetching the loki_push_api library:
ubuntu@charm-dev:~/fastapi-demo$ charmcraft fetch-lib charms.loki_k8s.v0.loki_push_api
This should add to your charm directory the structure below:
lib
└── charms
    ├── loki_k8s
    │   └── v0
    │       └── loki_push_api.py
Note: The loki_push_api library also depends on the juju_topology library, but you have already fetched it above for Prometheus.
Note: When you rebuild your charm with charmcraft pack, Charmcraft will copy the contents of the top lib directory to the project root. Thus, to import this library in your code, use just charms.loki_k8s.v0.loki_push_api.
Define the Loki relation interface
In your charmcraft.yaml file, beneath your existing requires endpoint, add another requires endpoint with relation name log-proxy and interface name loki_push_api. This declares that your charm can optionally make use of services from other charms over the loki_push_api interface. In short, that your charm is open to integrations with, for example, the official Loki charm. (Note: log-proxy is the default relation name recommended by the loki_push_api interface library.)
requires:
  database:
    interface: postgresql_client
    limit: 1
  log-proxy:
    interface: loki_push_api
    limit: 1
Read more:
requires
Import the Loki interface libraries and set up the Loki API
In your src/charm.py file, do the following:
First, import the loki_push_api lib:
from charms.loki_k8s.v0.loki_push_api import LogProxyConsumer
Then, in your charm’s __init__ method, initialise the LogProxyConsumer instance with the defined log files, as shown below. The log-proxy relation name comes from the charmcraft.yaml file and thedemo_server.log file is the file where the application dumps logs. Overall this code ensures that your application can push logs to Loki (or any other charms that implement the loki_push_api).
self._logging = LogProxyConsumer(
    self, relation_name="log-proxy", log_files=["demo_server.log"]
)
Congratulations, your charm can now also integrate with Loki!
Integrate with Grafana
Follow the steps below to make your charm capable of integrating with the existing Grafana charm. This will allow your charm user to visualise the data collected from Prometheus and Loki.
- Fetch the Grafana interface libraries
- Define the Grafana relation interface
- Import the Grafana interface libraries and set up the Grafana dashboards
Fetch the Grafana interface libraries
Ensure you’re in your Multipass Ubuntu VM, in your charm folder.
Then, satisfy the interface requirement of the Grafana charm by fetching the grafana_dashboard library:
ubuntu@charm-dev:~/fastapi-demo$ charmcraft fetch-lib charms.grafana_k8s.v0.grafana_dashboard
Your charm directory should now include the structure below:
lib
└── charms
    ├── grafana_k8s
    │   └── v0
    │       └── grafana_dashboard.py
Note: When you rebuild your charm with charmcraft pack, Charmcraft will copy the contents of the top lib directory to the project root. Thus, to import this library in your code, use just charms.grafana_k8s.v0.grafana_dashboard.
Note: The grafana_dashboard library also depends on the juju_topology library, but you have already fetched it above for Prometheus.
Define the Grafana relation interface
In your charmcraft.yaml file, add another provides endpoint with relation name grafana-dashboard and interface name grafana_dashboard, as below. This declares that your charm can offer services to other charms over the grafana-dashboard interface. In short, that your charm is open to integrations with, for example, the official Grafana charm. (Note: Here grafana-dashboard endpoint is the default relation name recommended by the grafana_dashboard library.)
provides:
  metrics-endpoint:
    interface: prometheus_scrape
  grafana-dashboard:
    interface: grafana_dashboard
Read more:
provides
Import the Grafana interface libraries and set up the Grafana dashboards
In your src/charm.py file, do the following:
First, at the top of the file, import the grafana_dashboard lib:
from charms.grafana_k8s.v0.grafana_dashboard import GrafanaDashboardProvider
Now, in your charm’s __init__ method, initialise the GrafanaDashboardProvider instance, as below. The grafana-dashboard is the relation name you defined earlier in your charmcraft.yaml file. Overall, this code states that your application supports the Grafana interface.
# Provide grafana dashboards over a relation interface
self._grafana_dashboards = GrafanaDashboardProvider(self, relation_name="grafana-dashboard")
Now, in your src directory, create a subdirectory called grafana_dashboards and, in this directory, create a file called FastAPI-Monitoring.json.tmpl with the following content:
FastAPI-Monitoring.json.tmpl (7.7 KB) . Once your charm has been integrated with Grafana, the GrafanaDashboardProvider you defined just before will take this file as well as any other files defined in this directory and put them into a Grafana files tree to be read by Grafana.
How to build a Grafana dashboard is beyond the scope of this tutorial. However, if you’d like to get a quick idea: The dashboard template file was created by manually building a Grafana dashboard using the Grafana web UI, then exporting it to a JSON file and updating the datasource uid for Prometheus and Loki from constant values to the dynamic variables "${prometheusds}" and "${lokids}", respectively.
Specify packages required to build
When packing a charm, charmcraft uses source distributions for the dependencies. When a charm has a dependency that includes a binary package charmcraft will build the package, but may require additional packages to be installed.
The cos-lite packages include a dependency that has Rust code, and the default charmcraft build environment does not have a Rust compiler, so you need to instruct charmcraft to install one for the build. In your charmcraft.yaml file, add a new parts section:
parts:
  charm:
    build-packages:
      # Required for the cos-lite packages, which have a Rust dependency.
      - cargo
Validate your charm
Open a shell in your Multipass Ubuntu VM, navigate inside your project directory, and run all of the following.
First, repack and refresh your charm:
charmcraft pack
juju refresh \
  --path="./demo-api-charm_ubuntu-22.04-amd64.charm" \
  demo-api-charm --force-units --resource \
  demo-server-image=ghcr.io/canonical/api_demo_server:1.0.1
Next, test your charm’s ability to integrate with Prometheus, Loki, and Grafana by following the steps below.
- Deploy COS Lite
- Expose the application integration endpoints
- Integrate your charm with COS Lite
- Access your applications from the host machine
- Log in to Grafana
- Inspect the dashboards
Deploy COS Lite
Create a Juju model called cos-lite and, to this model, deploy the Canonical Observability Stack bundle cos-lite, as below. This will deploy all the COS applications (alertmanager, catalogue, grafana, loki, prometheus, traefik), already suitably integrated with one another. Note that these also include the applications that you’ve been working to make your charm integrate with – Prometheus, Loki, and Grafana.
juju add-model cos-lite
juju deploy cos-lite --trust
Why put COS Lite in a separate model? Because (1) it is always a good idea to separate logically unrelated applications in different models and (2) this way you can observe applications across all your models. PS In a production-grade scenario you would actually even want to put your COS Lite in a separate cloud (i.e., Kubernetes cluster). This is recommended, for example, to ensure proper hardware resource allocation.
Expose the application integration endpoints
Once all the COS Lite applications are deployed and settled down (you can monitor this by using juju status --watch 2s), expose the integration points you are interested in for your charm – loki:logging, grafana-dashboard, and metrics-endpoint – as below.
juju offer prometheus:metrics-endpoint
juju offer loki:logging
juju offer grafana:grafana-dashboard
Validate that the offers have been successfully created by running:
juju find-offers cos-lite
You should something similar to the output below:
Store                 URL                        Access  Interfaces
tutorial-controller  admin/cos-lite.loki        admin   loki_push_api:logging
tutorial-controller  admin/cos-lite.prometheus  admin   prometheus_scrape:metrics-endpoint
tutorial-controller  admin/cos-lite.grafana     admin   grafana_dashboard:grafana-dashboard
As you might notice from your knowledge of Juju, this is essentially preparing these endpoints, which exist in the cos-lite model, for a cross-model relation with your charm, which you’ve deployed to the charm-model model.
Integrate your charm with COS Lite
Now switch back to the charm model and integrate your charm with the exposed endpoints, as below. This effectively integrates your application with Prometheus, Loki, and Grafana.
juju switch charm-model
juju integrate demo-api-charm admin/cos-lite.grafana
juju integrate demo-api-charm admin/cos-lite.loki
juju integrate demo-api-charm admin/cos-lite.prometheus
Access your applications from the host machine
The power of Grafana lies in the way it allows you to visualise metrics on a dashboard. Thus, in the general case you will want to open the Grafana Web UI in a web browser. However, you are now working in a headless VM that does not have any user interface. This means that you will need to open Grafana in a web browser on your host machine. To do this, you will need to add IP routes to the Kubernetes (MicroK8s) network inside of our VM. You can skip this step if you have decided to follow this tutorial directly on your host machine.
First, run:
juju status -m cos-lite
This should result in an output similar to the one below:
Model     Controller            Cloud/Region        Version  SLA          Timestamp
cos-lite  tutorial-controller  microk8s/localhost  3.0.0    unsupported  18:05:07+01:00

App           Version  Status   Scale  Charm             Channel  Rev  Address         Exposed  Message
alertmanager  0.23.0   active       1  alertmanager-k8s  stable    36  10.152.183.70   no
catalogue              active       1  catalogue-k8s     stable     4  10.152.183.19   no
grafana       9.2.1    active       1  grafana-k8s       stable    52  10.152.183.132  no
loki          2.4.1    active       1  loki-k8s          stable    47  10.152.183.207  no
prometheus    2.33.5   active       1  prometheus-k8s    stable    79  10.152.183.196  no
traefik                active       1  traefik-k8s       stable    93  10.152.183.83   no
From this output, from the Address column, retrieve the IP address for each app to obtain the Kubernetes service IP address range. Make a note of each as well as the range. (In our output we got the 10.152.183.0-10.152.183.255 range.)
Do not mix up Apps and Units – Units represent Kubernetes pods while Apps represent Kubernetes Services. Note: The charm should be programmed to support Services.
Now open a terminal on your host machine and run:
multipass info charm-dev
This should result in an output similar to the one below:
Name:           charm-dev
State:          Running
IPv4:           10.112.13.157
                10.49.132.1
                10.1.157.64
Release:        Ubuntu 22.04.1 LTS
Image hash:     1d24e397489d (Ubuntu 22.04 LTS)
Load:           0.31 0.25 0.28
Disk usage:     15.9G out of 19.2G
Memory usage:   2.1G out of 7.8G
Mounts:         /home/maksim/fastapi-demo => ~/fastapi-demo
                    UID map: 1000:default
                    GID map: 1000:default
From this output, retrieve your Multipass Ubuntu VM’s network IP address. In our case it is 10.112.13.157.
Now, also on your host machine, run the code below. Until the next reboot, this will forward all the traffic for your Kubernetes Service IP range via the network on your VM. This will allow you, for example, to view your Grafana dashboards in a web browser inside your VM, as we do in the next step.
sudo ip route add 10.152.183.0/24 via 10.112.13.157
Log in to Grafana
In a terminal inside your VM, do all of the following:
First, run juju status again to retrieve the IP address of your Grafana service. For us it is http://10.152.183.132:3000 (see the output above).
Now, use juju run to retrieve your Grafana password, as shown below.
juju run grafana/0 -m cos-lite get-admin-password --wait 1m
Now, on your host machine, open a web browser, enter the Grafana IP address, and use the username “admin” and your Grafana password to log in.
Inspect the dashboards
In your Grafana web page, do all of the following:
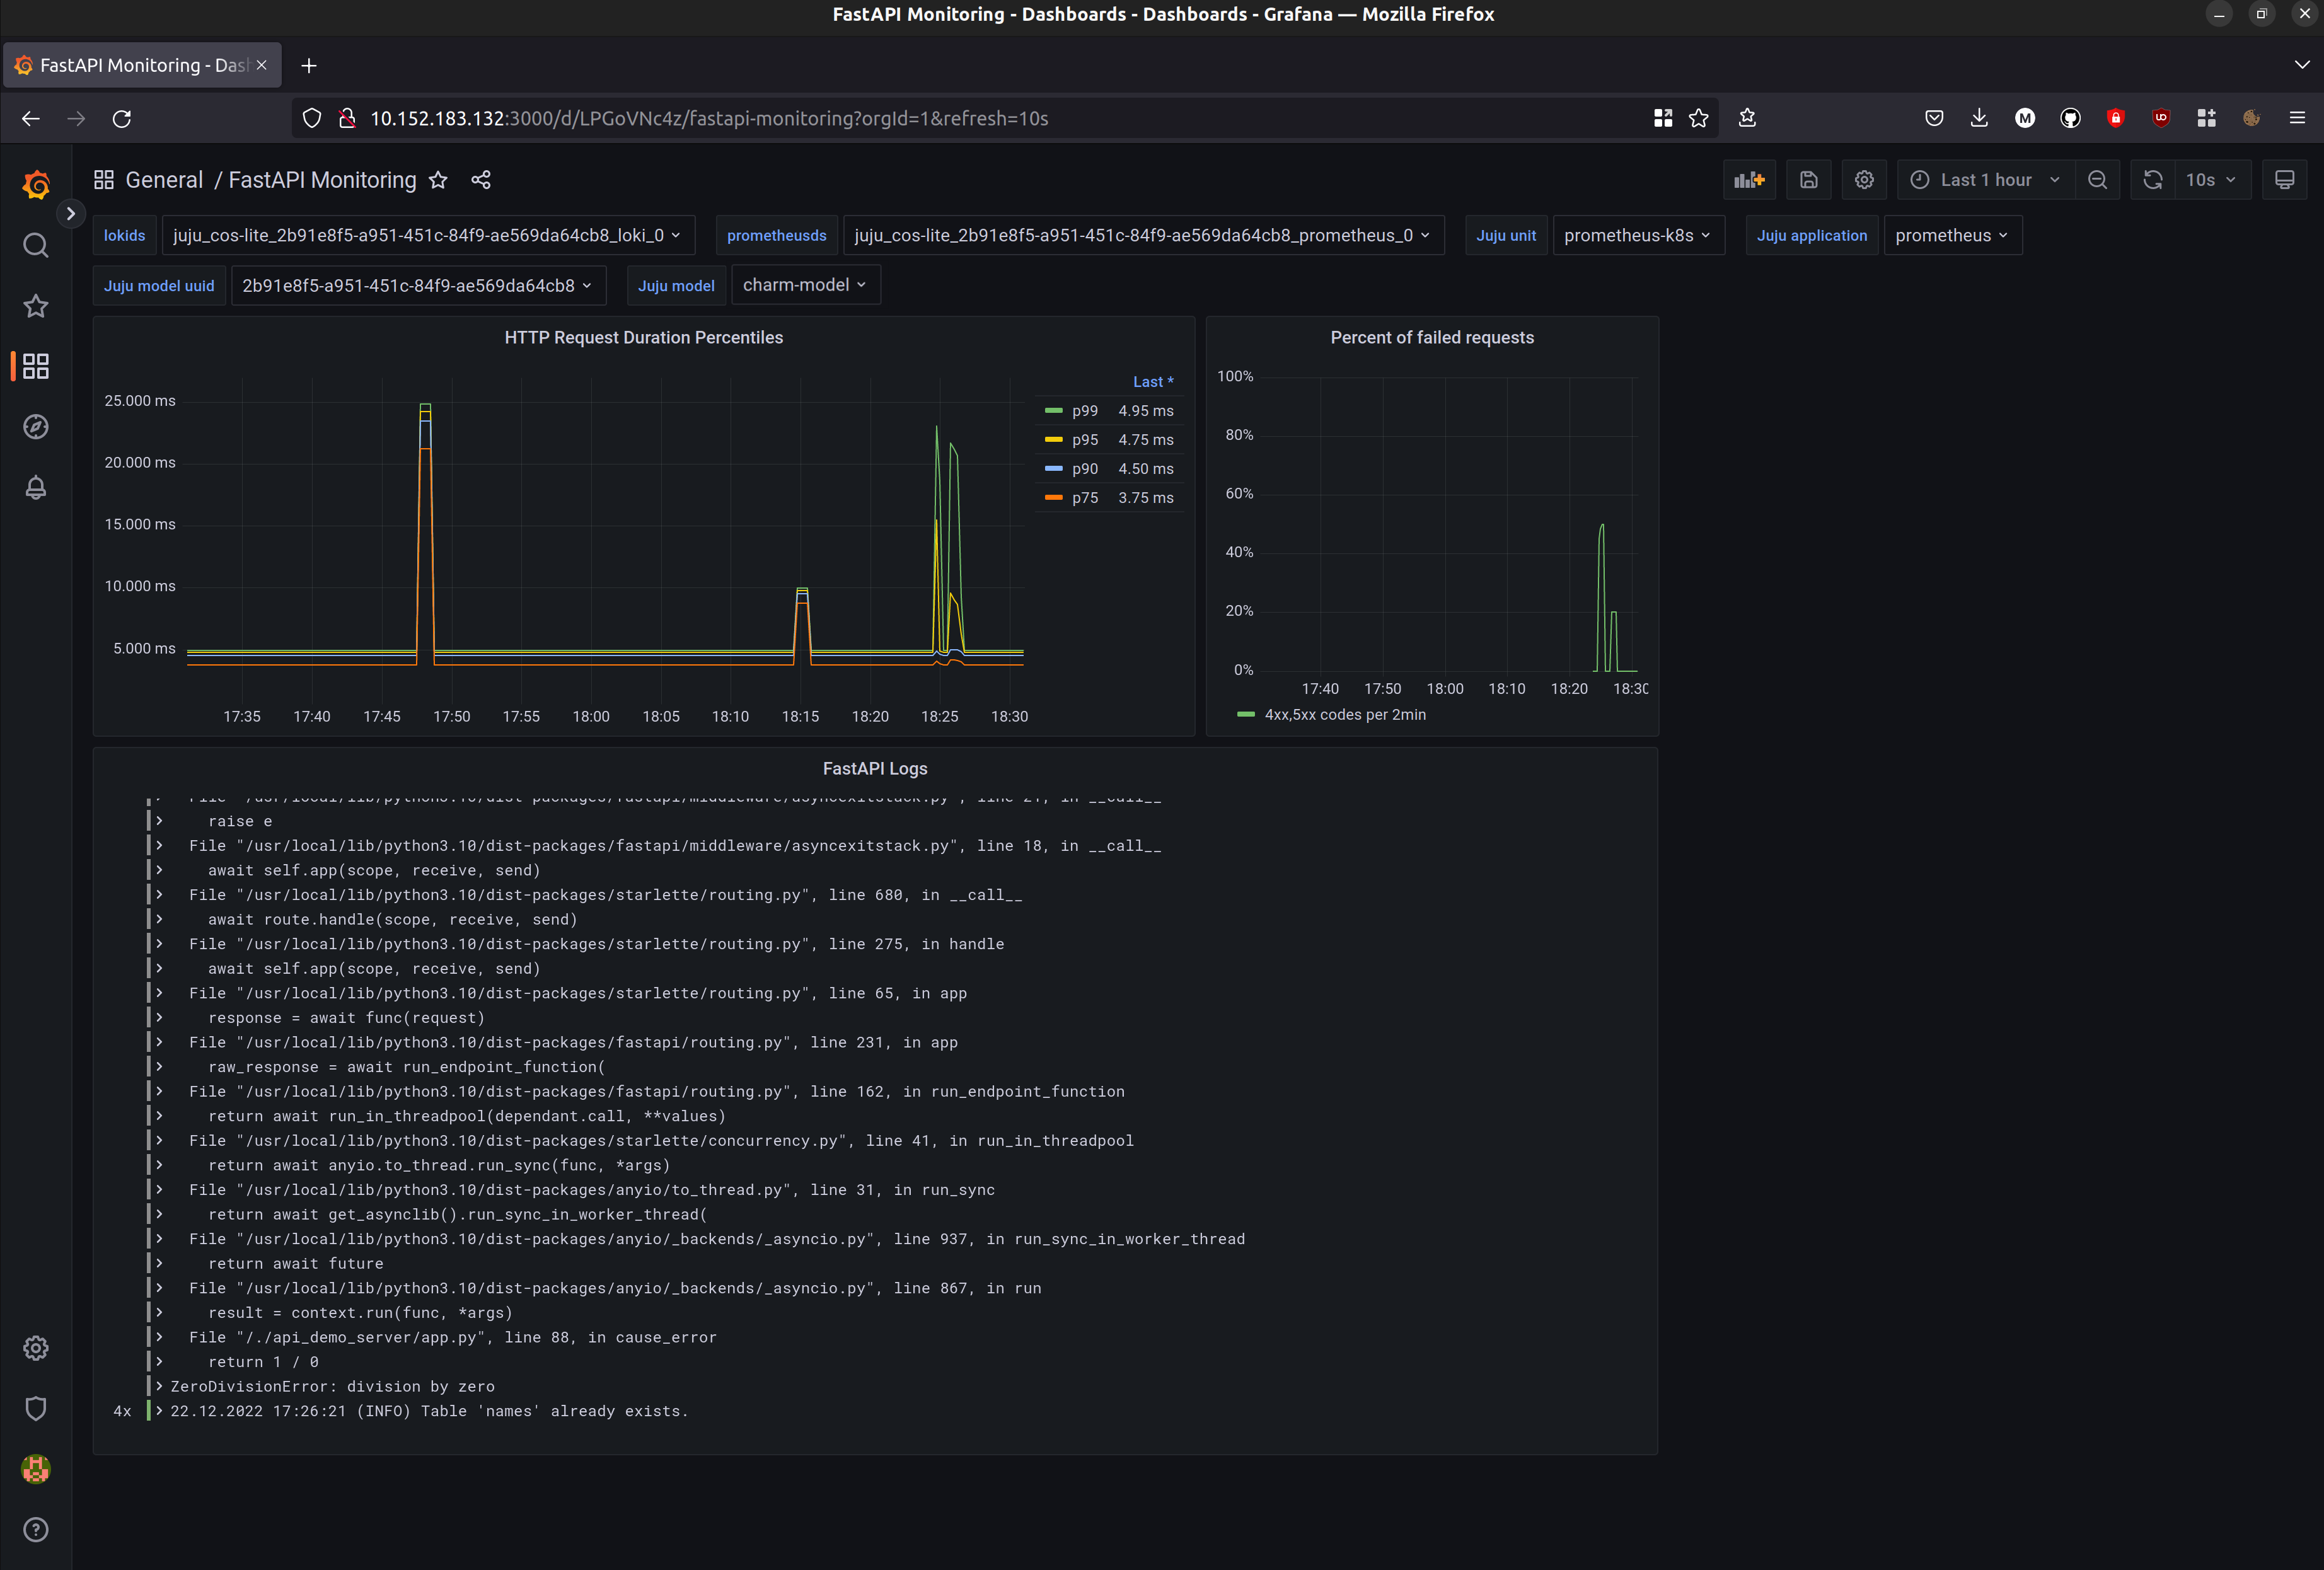
Click FastAPI Monitoring. You should see the Grafana Dashboard that we uploaded to the grafana_dashboards directory of your charm.
Next, in the Juju model drop down field, select charm-model.
Now, call a couple of API points on the application, as below. To produce some successful requests and some requests with code 500 (internal server error), call several times, in any order.
curl 10.1.157.94:8000/names
and
curl 10.1.157.94:8000/error
where 10.1.157.94 is the IP of our application unit (pod).
In a while you should see the following data appearing on the dashboard:
- HTTP Request Duration Percentiles. This dashboard is based on the data from Prometheus and will allow you to see what fraction of requests takes what amount of time.
- Percent of failed requests per 2 minutes time frame. In your case this will be a ratio of all the requests and the requests submitted to the
/errorpath (i.e., the ones that cause the Internal Server Error). - Logs from your application that were collected by Loki and forwarded to Grafana. Here you can see some INFO level logs and ERROR logs with traceback from Python when you were calling the
/errorpath.
If you are interested in the Prometheus metrics produced by your application that were used to build these dashboards you can run following command in your VM: curl <your app pod IP>:8000/metrics
Also, you can reach Prometheus in your web browser (similar to Grafana) at http://<Prometheus pod IP>:9090/graph .
Review the final code
For the full code see: 07_cos_integration
For a comparative view of the code before and after this doc see: Comparison
See next: Write units tests for your charm
Contributors: @beliaev-maksim, @louiseschmidtgen, @mmkay, @tony-meyer, @tmihoc
