
As part of our roadmap, we are currently working on adding support for GPU resources to Charmed Apache Kyuubi. In this post, we’ll explore how we can use pieces of the Charm ecosystem to monitor a GPU.
The experiment plan
The whole experiment will last for more than 6 hours, so let’s spin up my personal desktop for convenience instead of using company hardware. This venerable hexa-core 32GB machine with an RTX 3070 will run all the following, in addition to keeping my feet even warmer than they need to be in August. Ok, we can hardly call it “venerable,” since the 3070 was first released in 2020, but it certainly feels so lately.
We first install Juju 3.6.9 and MicroK8s 1.32 (non-strict).
The non-strict bit is critical, as the gpu add-on cannot be used with the strictly confined flavor.
For convenience, I made some time ago the following concierge.yaml to get most of the tooling we require:
juju:
  enable: true

providers:
  microk8s:
    enable: true
    channel: 1.32/stable
    bootstrap: false
    addons:
      - dns
      - hostpath-storage
      - metallb:10.64.140.43-10.64.140.49
      - gpu
      - minio

  lxd:
    enable: true
    bootstrap: false

host:
  packages:
    - git
    - unzip
    - make
    - ubuntu-drivers-common
    - libpq-dev
    - gcc
    - python3-dev
    - pipx
  snaps:
    helix:
      channel: latest/stable
    yq:
      channel: latest/stable
    charmcraft:
      channel: latest/stable
    rockcraft:
      channel: latest/stable
   spark-client:
      channel: 3.4/stable
    jhack:
      channel: latest/edge
      connections:
        - jhack:dot-local-share-juju snapd
Bootstrapping a controller on a non-strict MicroK8s needs one additional step not covered (yet?) by concierge: writing the kubeconfig file to ~/.kube/config. Easy enough, just a few more commands and we get our environment ready:
sudo concierge prepare
microk8s config > ~/.kube/config
juju add-k8s mk8s --client
juju bootstrap mk8s mk8s
We can check that the gpu add-on is properly working by looking at the node resources:
kubectl get node desktop -o=jsonpath="{.status.capacity."nvidia.com/gpu"}"
# 1
We have a custom resource; we’re good to go.
This big plan will be to query the Charmed Apache Kyuubi unit to spawn a spark executor pod with GPU support so that we can run hardware-accelerated queries.
We will deploy a custom version of the Charmed Apache Spark bundle using Terraform, including COS lite. Minor, uninteresting changes were made to the bundle to save resources, except for one: deploying a single unit using an unreleased build of the Charmed Apache Kyuubi operator with GPU support.
One juju config kyuubi-k8s enable-gpu=true later and we can proceed with the final step: first, we get the credentials from the data-integrator charm, then we use the beeline client bundled in the spark-client snap.
juju run data-integrator/0 get-credentials
# get <jdbc-endpoint>, <username> and <password>

spark-client.beeline -u "<jdbc-endpoint>" -n <username> -p <password>
A few moments later, the prompt is up and running, and a trivial select 1; already shows the query plan being converted to GPU code.
On COS’ side, we get the URL and the password for Grafana, and we’re good to go.
juju run -m cos traefik/0 show-proxied-endpoints
juju run -m cos grafana/0 get-admin-password
Let’s agree that this is not the most impressive use of a GPU you’ve seen and move on to the next part.
A (short and incomplete) introduction to GPUs on K8s
Go check the reference section to know more about using GPUs, the summary boils down to two things:
- We need to use the executor pod template spark property to allow spark jobs to use the GPU by requesting a custom resource.
- GPUs are tricky to share. The custom resources on K8s cannot be fractionated. We can trick the cluster into considering a single hardware unit as multiple virtual ones, but that’s beyond the scope of this post.
That’s it for the introduction. The tl;dr of the tl;dr is: GPU resources are quite particular in a K8s environment, and monitoring them is no exception.
They are not part of the usual metrics exposed by spark jobs and the JMX exporter, so they will not appear on the Spark History Server nor on the already available dashboards we have for Charmed Apache Spark.
Using NVIDIA GPUs in a K8s cluster is done by deploying the gpu-operator, which comes with a dedicated component to export metrics: the dcgm-exporter.
On a non-strict MicroK8s cluster, enabling the gpu add-on creates a new namespace called gpu-operator-resources.
kubectl get pods -n gpu-operator-resources

NAME                                                          READY   STATUS
gpu-feature-discovery-l5g5k                                   1/1     Running
gpu-operator-85776c76f-7jzp2                                  1/1     Running
gpu-operator-node-feature-discovery-gc-d8f9f89db-77rz9        1/1     Running
gpu-operator-node-feature-discovery-master-79978f78cf-bslkt   1/1     Running
gpu-operator-node-feature-discovery-worker-vvg6w              1/1     Running
nvidia-container-toolkit-daemonset-r5lq2                      1/1     Running
nvidia-cuda-validator-76t6r                                   0/1     Completed
nvidia-dcgm-exporter-s92ln                                    1/1     Running
nvidia-device-plugin-daemonset-92xnm                          1/1     Running
nvidia-operator-validator-d7hhh                               1/1     Running
We can see in the output above the dcgm-exporter pod. This resource is exposed under a ClusterIP service.
kubectl get svc -n gpu-operator-resources

NAME                   TYPE        CLUSTER-IP       EXTERNAL-IP   PORT(S)    AGE
gpu-operator           ClusterIP   10.152.183.204   <none>        8080/TCP   7d16h
nvidia-dcgm-exporter   ClusterIP   10.152.183.176   <none>        9400/TCP   7d16h
Querying this service gives us the metrics we want:
curl -s 10.152.183.176:9400/metrics

# HELP DCGM_FI_DEV_SM_CLOCK SM clock frequency (in MHz).
# TYPE DCGM_FI_DEV_SM_CLOCK gauge
DCGM_FI_DEV_SM_CLOCK{gpu="0",UUID="GPU-d5d9839b-18e7-1857-5678-566a9c029d3c",pci_bus_id="00000000:01:00.0",device="nvidia0",modelName="NVIDIA GeForce RTX 3070",Hostname="desktop",DCGM_FI_DRIVER_VERSION="570.169"} 210
# HELP DCGM_FI_DEV_MEM_CLOCK Memory clock frequency (in MHz).
# TYPE DCGM_FI_DEV_MEM_CLOCK gauge
DCGM_FI_DEV_MEM_CLOCK{gpu="0",UUID="GPU-d5d9839b-18e7-1857-5678-566a9c029d3c",pci_bus_id="00000000:01:00.0",device="nvidia0",modelName="NVIDIA GeForce RTX 3070",Hostname="desktop",DCGM_FI_DRIVER_VERSION="570.169"} 405
# HELP DCGM_FI_DEV_MEMORY_TEMP Memory temperature (in C).
# TYPE DCGM_FI_DEV_MEMORY_TEMP gauge
DCGM_FI_DEV_MEMORY_TEMP{gpu="0",UUID="GPU-d5d9839b-18e7-1857-5678-566a9c029d3c",pci_bus_id="00000000:01:00.0",device="nvidia0",modelName="NVIDIA GeForce RTX 3070",Hostname="desktop",DCGM_FI_DRIVER_VERSION="570.169"} 0
# HELP DCGM_FI_DEV_GPU_TEMP GPU temperature (in C).
# TYPE DCGM_FI_DEV_GPU_TEMP gauge
DCGM_FI_DEV_GPU_TEMP{gpu="0",UUID="GPU-d5d9839b-18e7-1857-5678-566a9c029d3c",pci_bus_id="00000000:01:00.0",device="nvidia0",modelName="NVIDIA GeForce RTX 3070",Hostname="desktop",DCGM_FI_DRIVER_VERSION="570.169"} 50
# HELP DCGM_FI_DEV_POWER_USAGE Power draw (in W).
# TYPE DCGM_FI_DEV_POWER_USAGE gauge
DCGM_FI_DEV_POWER_USAGE{gpu="0",UUID="GPU-d5d9839b-18e7-1857-5678-566a9c029d3c",pci_bus_id="00000000:01:00.0",device="nvidia0",modelName="NVIDIA GeForce RTX 3070",Hostname="desktop",DCGM_FI_DRIVER_VERSION="570.169"} 18.726000
# HELP DCGM_FI_DEV_TOTAL_ENERGY_CONSUMPTION Total energy consumption since boot (in mJ).
# TYPE DCGM_FI_DEV_TOTAL_ENERGY_CONSUMPTION counter
DCGM_FI_DEV_TOTAL_ENERGY_CONSUMPTION{gpu="0",UUID="GPU-d5d9839b-18e7-1857-5678-566a9c029d3c",pci_bus_id="00000000:01:00.0",device="nvidia0",modelName="NVIDIA GeForce RTX 3070",Hostname="desktop",DCGM_FI_DRIVER_VERSION="570.169"} 1623327451
# HELP DCGM_FI_DEV_PCIE_REPLAY_COUNTER Total number of PCIe retries.
# TYPE DCGM_FI_DEV_PCIE_REPLAY_COUNTER counter
DCGM_FI_DEV_PCIE_REPLAY_COUNTER{gpu="0",UUID="GPU-d5d9839b-18e7-1857-5678-566a9c029d3c",pci_bus_id="00000000:01:00.0",device="nvidia0",modelName="NVIDIA GeForce RTX 3070",Hostname="desktop",DCGM_FI_DRIVER_VERSION="570.169"} 0
# HELP DCGM_FI_DEV_GPU_UTIL GPU utilization (in %).
# TYPE DCGM_FI_DEV_GPU_UTIL gauge
DCGM_FI_DEV_GPU_UTIL{gpu="0",UUID="GPU-d5d9839b-18e7-1857-5678-566a9c029d3c",pci_bus_id="00000000:01:00.0",device="nvidia0",modelName="NVIDIA GeForce RTX 3070",Hostname="desktop",DCGM_FI_DRIVER_VERSION="570.169"} 0
# HELP DCGM_FI_DEV_MEM_COPY_UTIL Memory utilization (in %).
# TYPE DCGM_FI_DEV_MEM_COPY_UTIL gauge
DCGM_FI_DEV_MEM_COPY_UTIL{gpu="0",UUID="GPU-d5d9839b-18e7-1857-5678-566a9c029d3c",pci_bus_id="00000000:01:00.0",device="nvidia0",modelName="NVIDIA GeForce RTX 3070",Hostname="desktop",DCGM_FI_DRIVER_VERSION="570.169"} 9
# HELP DCGM_FI_DEV_ENC_UTIL Encoder utilization (in %).
# TYPE DCGM_FI_DEV_ENC_UTIL gauge
DCGM_FI_DEV_ENC_UTIL{gpu="0",UUID="GPU-d5d9839b-18e7-1857-5678-566a9c029d3c",pci_bus_id="00000000:01:00.0",device="nvidia0",modelName="NVIDIA GeForce RTX 3070",Hostname="desktop",DCGM_FI_DRIVER_VERSION="570.169"} 0
# HELP DCGM_FI_DEV_DEC_UTIL Decoder utilization (in %).
# TYPE DCGM_FI_DEV_DEC_UTIL gauge
DCGM_FI_DEV_DEC_UTIL{gpu="0",UUID="GPU-d5d9839b-18e7-1857-5678-566a9c029d3c",pci_bus_id="00000000:01:00.0",device="nvidia0",modelName="NVIDIA GeForce RTX 3070",Hostname="desktop",DCGM_FI_DRIVER_VERSION="570.169"} 0
# HELP DCGM_FI_DEV_XID_ERRORS Value of the last XID error encountered.
# TYPE DCGM_FI_DEV_XID_ERRORS gauge
DCGM_FI_DEV_XID_ERRORS{gpu="0",UUID="GPU-d5d9839b-18e7-1857-5678-566a9c029d3c",pci_bus_id="00000000:01:00.0",device="nvidia0",modelName="NVIDIA GeForce RTX 3070",Hostname="desktop",DCGM_FI_DRIVER_VERSION="570.169",err_code="0",err_msg="No Error"} 0
# HELP DCGM_FI_DEV_FB_FREE Framebuffer memory free (in MiB).
# TYPE DCGM_FI_DEV_FB_FREE gauge
DCGM_FI_DEV_FB_FREE{gpu="0",UUID="GPU-d5d9839b-18e7-1857-5678-566a9c029d3c",pci_bus_id="00000000:01:00.0",device="nvidia0",modelName="NVIDIA GeForce RTX 3070",Hostname="desktop",DCGM_FI_DRIVER_VERSION="570.169"} 7685
# HELP DCGM_FI_DEV_FB_USED Framebuffer memory used (in MiB).
# TYPE DCGM_FI_DEV_FB_USED gauge
DCGM_FI_DEV_FB_USED{gpu="0",UUID="GPU-d5d9839b-18e7-1857-5678-566a9c029d3c",pci_bus_id="00000000:01:00.0",device="nvidia0",modelName="NVIDIA GeForce RTX 3070",Hostname="desktop",DCGM_FI_DRIVER_VERSION="570.169"} 143
# HELP DCGM_FI_DEV_NVLINK_BANDWIDTH_TOTAL Total number of NVLink bandwidth counters for all lanes.
# TYPE DCGM_FI_DEV_NVLINK_BANDWIDTH_TOTAL counter
DCGM_FI_DEV_NVLINK_BANDWIDTH_TOTAL{gpu="0",UUID="GPU-d5d9839b-18e7-1857-5678-566a9c029d3c",pci_bus_id="00000000:01:00.0",device="nvidia0",modelName="NVIDIA GeForce RTX 3070",Hostname="desktop",DCGM_FI_DRIVER_VERSION="570.169"} 0
# HELP DCGM_FI_DEV_VGPU_LICENSE_STATUS vGPU License status
# TYPE DCGM_FI_DEV_VGPU_LICENSE_STATUS gauge
DCGM_FI_DEV_VGPU_LICENSE_STATUS{gpu="0",UUID="GPU-d5d9839b-18e7-1857-5678-566a9c029d3c",pci_bus_id="00000000:01:00.0",device="nvidia0",modelName="NVIDIA GeForce RTX 3070",Hostname="desktop",DCGM_FI_DRIVER_VERSION="570.169"} 0
First attempt: Prometheus scrape target charm
The Observability team created the Prometheus scrape target charm, which can be configured to add new scraping targets to Prometheus.
juju deploy prometheus-scrape-target-k8s --config targets="10.152.183.176:9400" --config metrics_path=metrics --config scheme=http --config job_name="dcgm_plain_test"

juju integrate prometheus-scrape-target-k8s:metrics-endpoint  grafana-agent:metrics-endpoint
We manually import the DCGM exporter dashboard into Grafana, and we already have some graphs running:
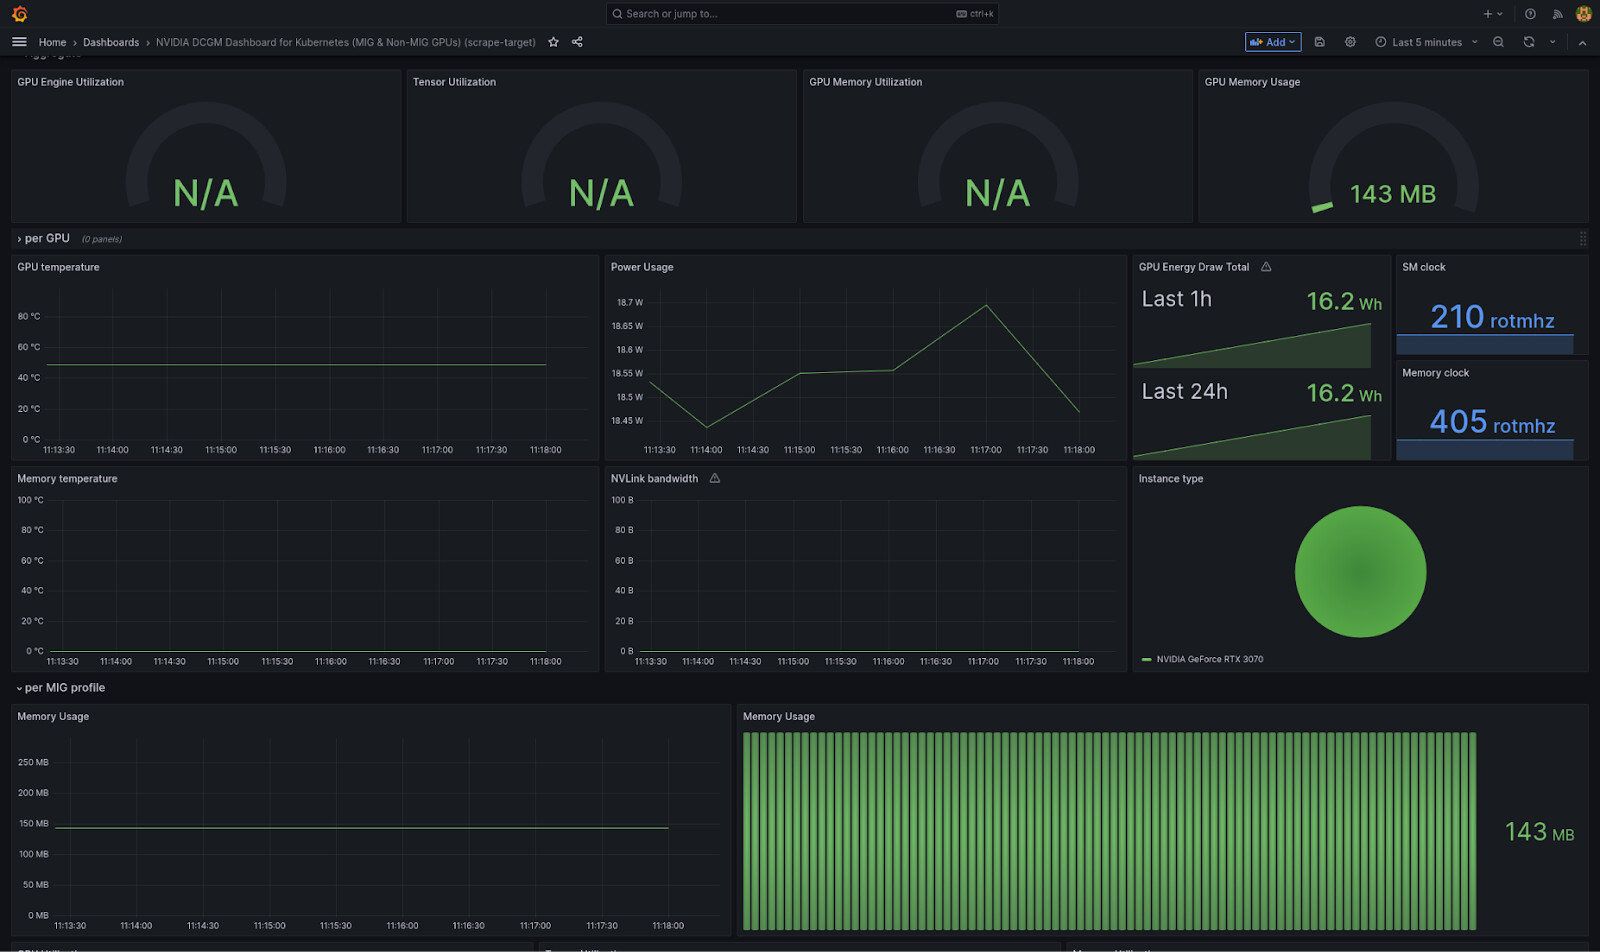
So much buildup for such an easy and successful first try!
Let’s export this dashboard’s json model for our second attempt.
Second attempt: gpu-metrics-gateway
The first attempt is already quite promising, but let’s go even further.
Having a dedicated charm to forward GPU metrics would let us automatically load the dashboard in Grafana and improve the UX by displaying informative statuses (such as a blocked status if we cannot find the dcgm-exporter service or if we need to trust the charm).
Let’s create a new charm named gpu-metrics-gateway (source).
This new charm will be quite simple, as it only needs to (1) configure a new scrape target on Prometheus and (2) load a new dashboard in Grafana.
The first part is done by directly querying the Kubernetes API to find the ClusterIP address and port for the DCGM service, then writing a new scrape job definition in the metrics-endpoint relation databag.
The second needs us to include the json file we got from our first attempt, changing the datasources as needed and fetching the grafana_dashboard.py charm lib.
We defined two configuration options dcgm-exporter-service and dcgm-exporter-namespace with default values set to what we expect from MicroK8s, so this experiment should keep the manual configuration to a minimum.
Let’s pack, deploy and integrate!
charmcraft pack
juju deploy ./gpu-metrics-gateway_ubuntu@22.04-amd64.charm
juju integrate gpu-metrics-gateway:metrics-endpoint  grafana-agent:metrics-endpoint
juju integrate gpu-metrics-gateway:grafana-dashboard  grafana-agent:grafana-dashboards-consumer
Once we relate this new charm to the COS components on the two endpoints, grafana-dashboard and metrics-endpoint, and wait for everything to settle down, we get a new dashboard automatically loaded in Grafana:
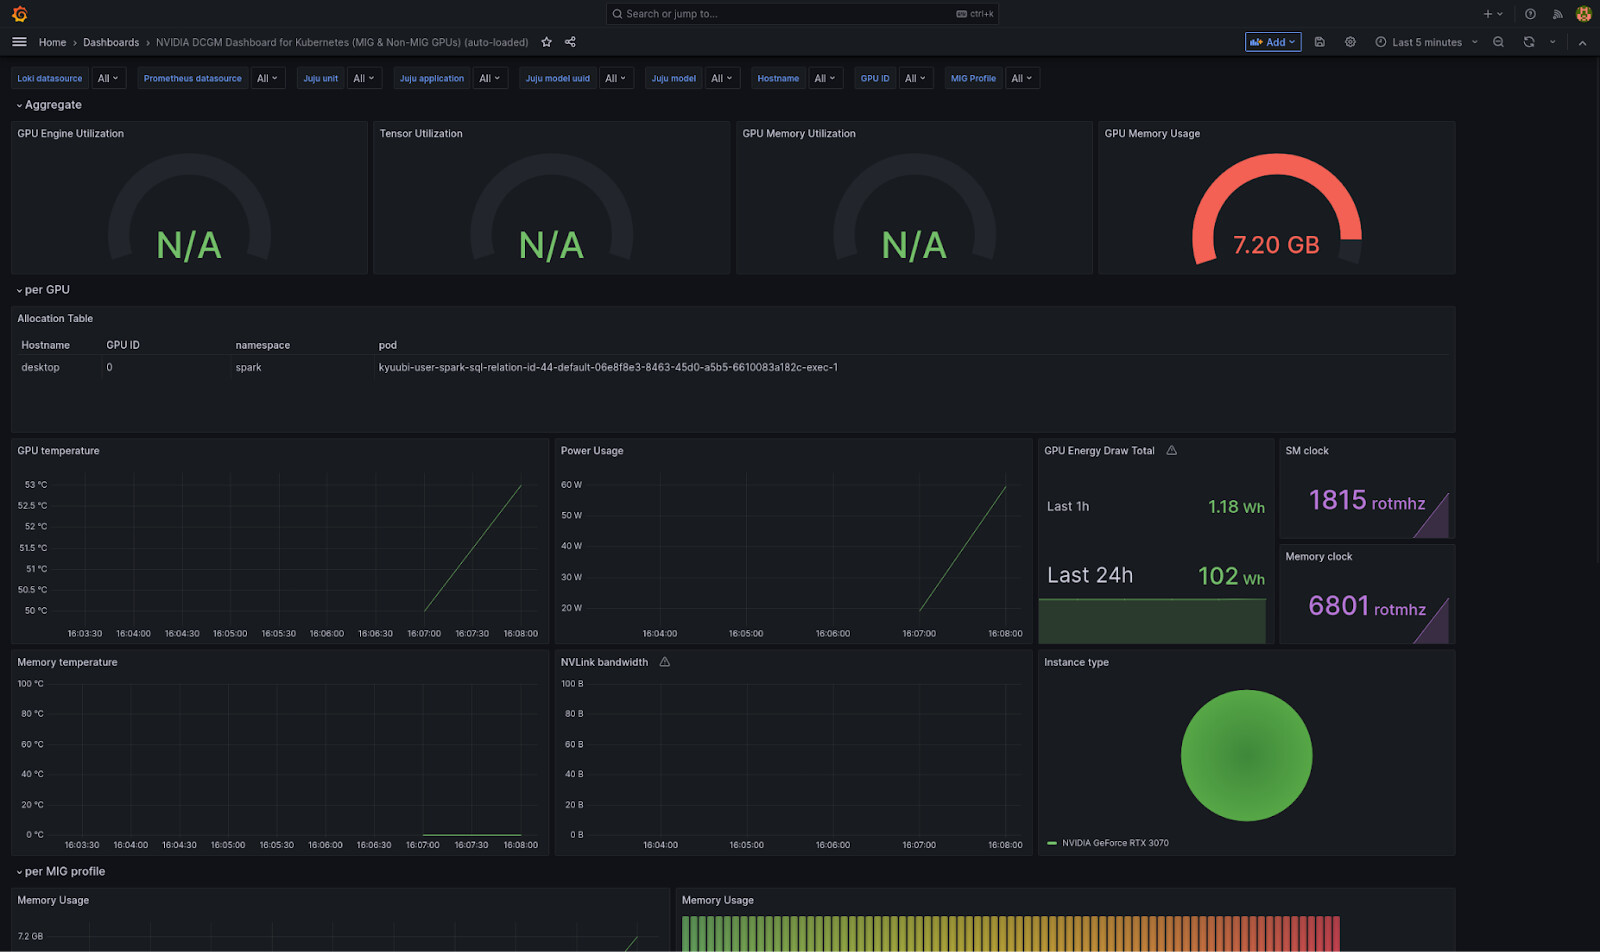
We fiddled with the dashboard queries before exporting its json model, so that we can get the pod accessing the GPU.
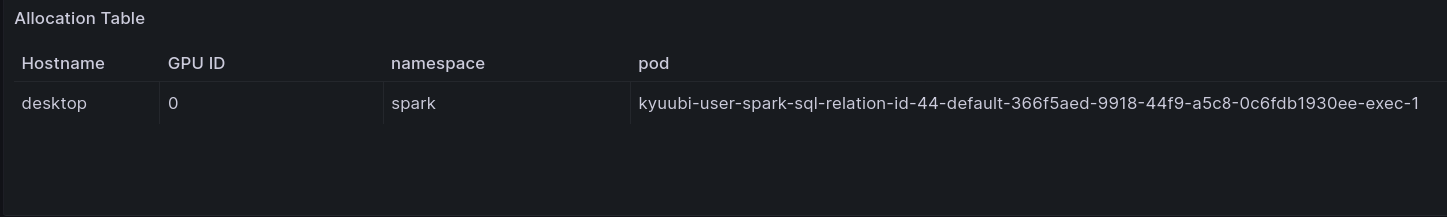
That’s it, we can monitor the state of our GPU in COS and see which pod is currently using it!
References
- Grafana DCGM exporter dashboard: https://grafana.com/grafana/dashboards/23382-nvidia-mig-dcgm/
- NVIDIA DCGM exporter: https://github.com/NVIDIA/dcgm-exporter
- Scheduling GPUs on K8: https://kubernetes.io/docs/tasks/manage-gpus/scheduling-gpus/
- Spark RAPIDS plugin to run spark jobs on GPUs: https://github.com/NVIDIA/spark-rapids
- PoC charm: https://github.com/Batalex/gpu-metrics-gateway-operator