Using cross-model relations is no longer the recommended way to integrate Charmed Kubeflow with COS. The Grafana agent should be used instead. See Integrate CKF with COS for details.
Last verified: Mar 3, 2023
Contents:
- Overview
- Requirements
- Instructions
Overview
This guide is intended to introduce end users to the integration of Kubeflow and COS (Canonical Observability Stack).
Requirements
- Deployed Kubeflow instance and access to Kubeflow dashboard. For sample Kubeflow deployment refer to https://charmed-kubeflow.io/docs/get-started-with-charmed-kubeflow. More details on Kubeflow can be found here Documentation | Kubeflow.
- Deployed COS with offers overlay. For steps, see deploy COS with overlays.
- Familiarity with Python, Jupyter Notebooks.
- Minimum system requirements: CPU 8 RAM 32GB DISK 120GB
- Tools:
microk8s,juju,yq,curl
Instructions
After deploying Kubeflow and COS there will be two models on the controller - kubeflow containing Kubeflow deployment and cos containing COS deployment.
Integration with COS involves adding relations to Prometheus to have access to metrics and to Grafana to provide dashboards. The following components provide built-in sample Grafana dashboards:
- Argo Controller
- Jupyter Notebook Controller
- Seldon Controller Manager
Prometheus integration
To relate Kubeflow deployment with Prometheus in COS:
juju switch kubeflow
juju add-relation argo-controller admin/cos.prometheus-scrape
juju add-relation dex-auth admin/cos.prometheus-scrape
juju add-relation katib-controller admin/cos.prometheus-scrape
juju add-relation kfp-api admin/cos.prometheus-scrape
juju add-relation metacontroller-operator admin/cos.prometheus-scrape
juju add-relation minio admin/cos.prometheus-scrape
juju add-relation seldon-controller-manager admin/cos.prometheus-scrape
juju add-relation training-operator admin/cos.prometheus-scrape
juju add-relation jupyter-controller admin/cos.prometheus-scrape
Grafana integration
To relate Kubeflow deployment with Grafana in COS:
juju switch kubeflow
juju add-relation jupyter-controller admin/cos.grafana-dashboards
juju add-relation seldon-controller-manager admin/cos.grafana-dashboards
juju add-relation argo-controller admin/cos.grafana-dashboards
Access Prometheus metrics
Follow COS documentation on how to access Prometheus metrics. Browse dashboards section or obtain IP address using juju show-unit command:
juju switch cos
PROMETHEUS_IP=$(juju show-unit prometheus/0 --format yaml | yq .prometheus/0.address)
curl "http://$PROMETHEUS_IP:9090"
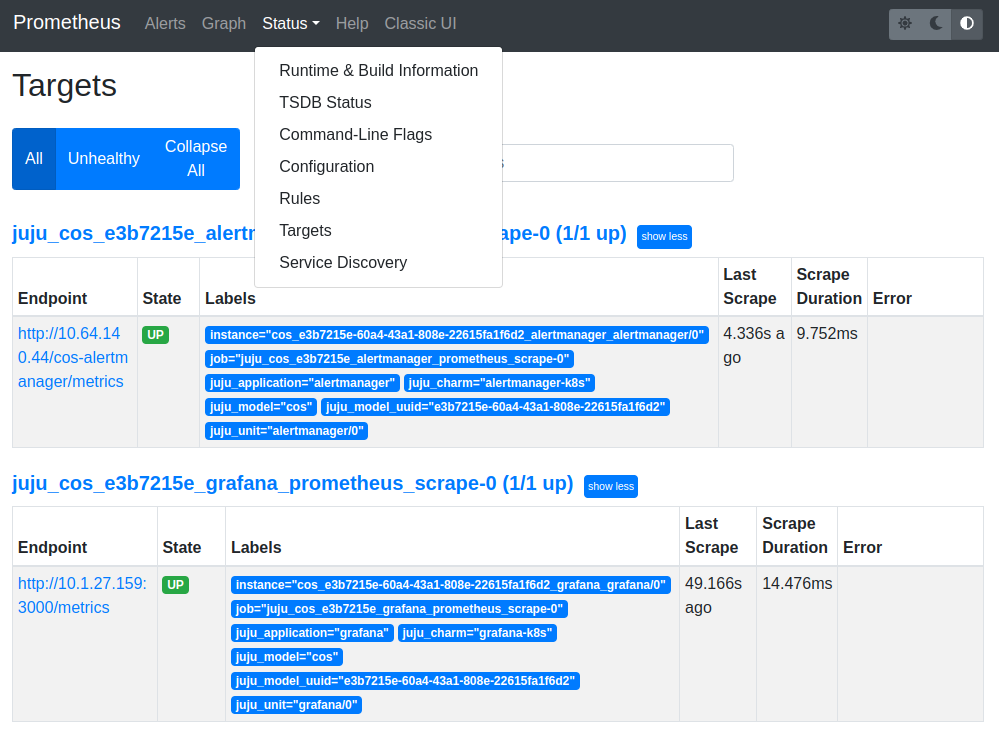
Navigate to Prometheus metrics URL, eg. http://<prometheus-unit-ip>:9090. Navigate to Status- > Targets to see available metrics for various components that were related to Prometheus.
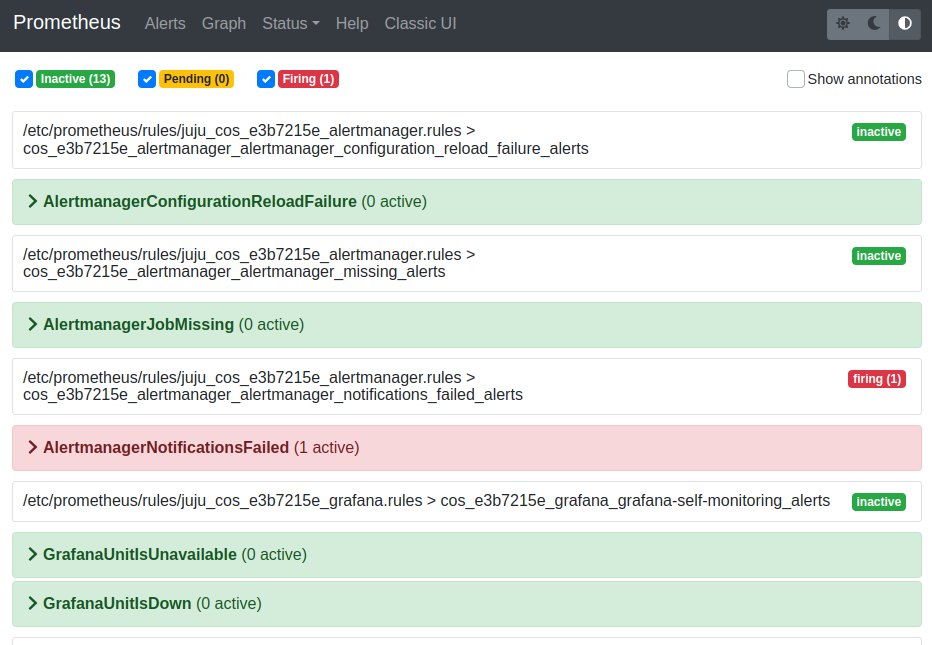
Access Prometheus alerts
In order to see alerts available for Prometheus, through Prometheus metrics URL, navigate to “Alerts”.
List of alerts per Kubeflow component
Argo Workflows
| Alert | Expression and corresponding Argo Workflow metric | Severity |
|---|---|---|
| ArgoWorkflowErrorLoglines | increase(log_messages{level=“error”}[2m]) > 10 | Critical |
| ArgoWorkflowWarningLoglines | increase(log_messages{level=“warning”}[2m]) > 40 | Warning |
| ArgoUnitIsUnavailable | up < 1 | Critical |
| ArgoWorkflowsErroring | increase( argo_workflows_count{status=“Error”}[2m] ) > 1 | Warning |
| ArgoWorkflowsFailed | increase( argo_workflows_count{status=“Failed”}[2m]) > 1 | Warning |
| ArgoWorkflowsPending | increase( argo_workflows_count{status=“Pending”}[2m] ) > 1 | Warning |
Jupyter Notebook Controller
| Alert | Expression and corresponding Jupyter Notebook Controller metric | Severity |
|---|---|---|
| UnfinishedWorkQueueAlert | rate(workqueue_unfinished_work_seconds[5m]) >= 100 | Critical |
| FileDescriptorsExhausted | process_open_fds / process_max_fds >= 0.98 | Critical |
| FileDescriptorsSoonToBeExhausted | predict_linear((process_open_fds / process_max_fds)[5m:], 60*60) >= 1 | High |
| JupyterControllerRuntimeReconciliationErrorsExceedThreshold | rate(controller_runtime_reconcile_errors_total[5m]) > 0 | Critical |
| JupyterControllerUnitIsUnavailable | up < 1 | Critical |
Istio Pilot
| Alert | Expression and corresponding Istio Pilot metric | Severity |
|---|---|---|
| IstioPilotAvailabilityDrop | avg(avg_over_time(up[1m])) < 0.5 for: 5m | Critical |
Seldon Controller Manager
| Alert | Expression and corresponding Seldon Core Operator metric | Severity |
|---|---|---|
| SeldonWorkqueueTooManyRetries | rate(workqueue_retries_total[10m]) > 0 | Critical |
| SeldonHTTPError | rate(rest_client_requests_total{code=~“4.*”}[10m]) > 0 | Critical |
| SeldonReconcileError | rate(controller_runtime_reconcile_total{result=“error”}[10m]) > 0 | Critical |
| SeldonUnfinishedWorkIncrease | rate(workqueue_unfinished_work_seconds[10m]) > 0 | Critical |
| SeldonWebhookError | rate(controller_runtime_webhook_requests_total{code=“5.*”}[10m]) > 0 | Critical |
| SeldonUnitIsUnavailable | up < 1 | Critical |
Access Grafana dashboards
Follow COS documentation on how to access the Grafana dashboard Brosed dashboards section or obtain the IP address using juju show-unit command:
juju switch cos
GRAFANA_IP=$(juju show-unit grafana/0 --format yaml | yq .grafana/0.address)
curl -f -LI "http://$GRAFANA_IP:3000"
EXTERNAL_IP=$(microk8s kubectl -n cos get svc traefik -o jsonpath='{.status.loadBalancer.ingress[0].ip}')
curl -f -LI "http://$EXTERNAL_IP/cos-grafana-0"
Navigate to Grafana dashboard URL, eg. http://<grafana-unit-ip>:3000 or http://<external-ip>/cos-grafana-0
NOTE: If deployed on AWS use the following command to properly set EXTERNAL_IP address: EXTERNAL_IP=$(kubectl -n cos get svc traefik -o jsonpath='{.status.loadBalancer.ingress[0].hostname}')
Browse available dashboards by navigating to Dashboards -> Browse. There should be the following dashboards available:
- ArgoWorkflow Metrics
- Jupyter Notebook Controller
- Seldon Core
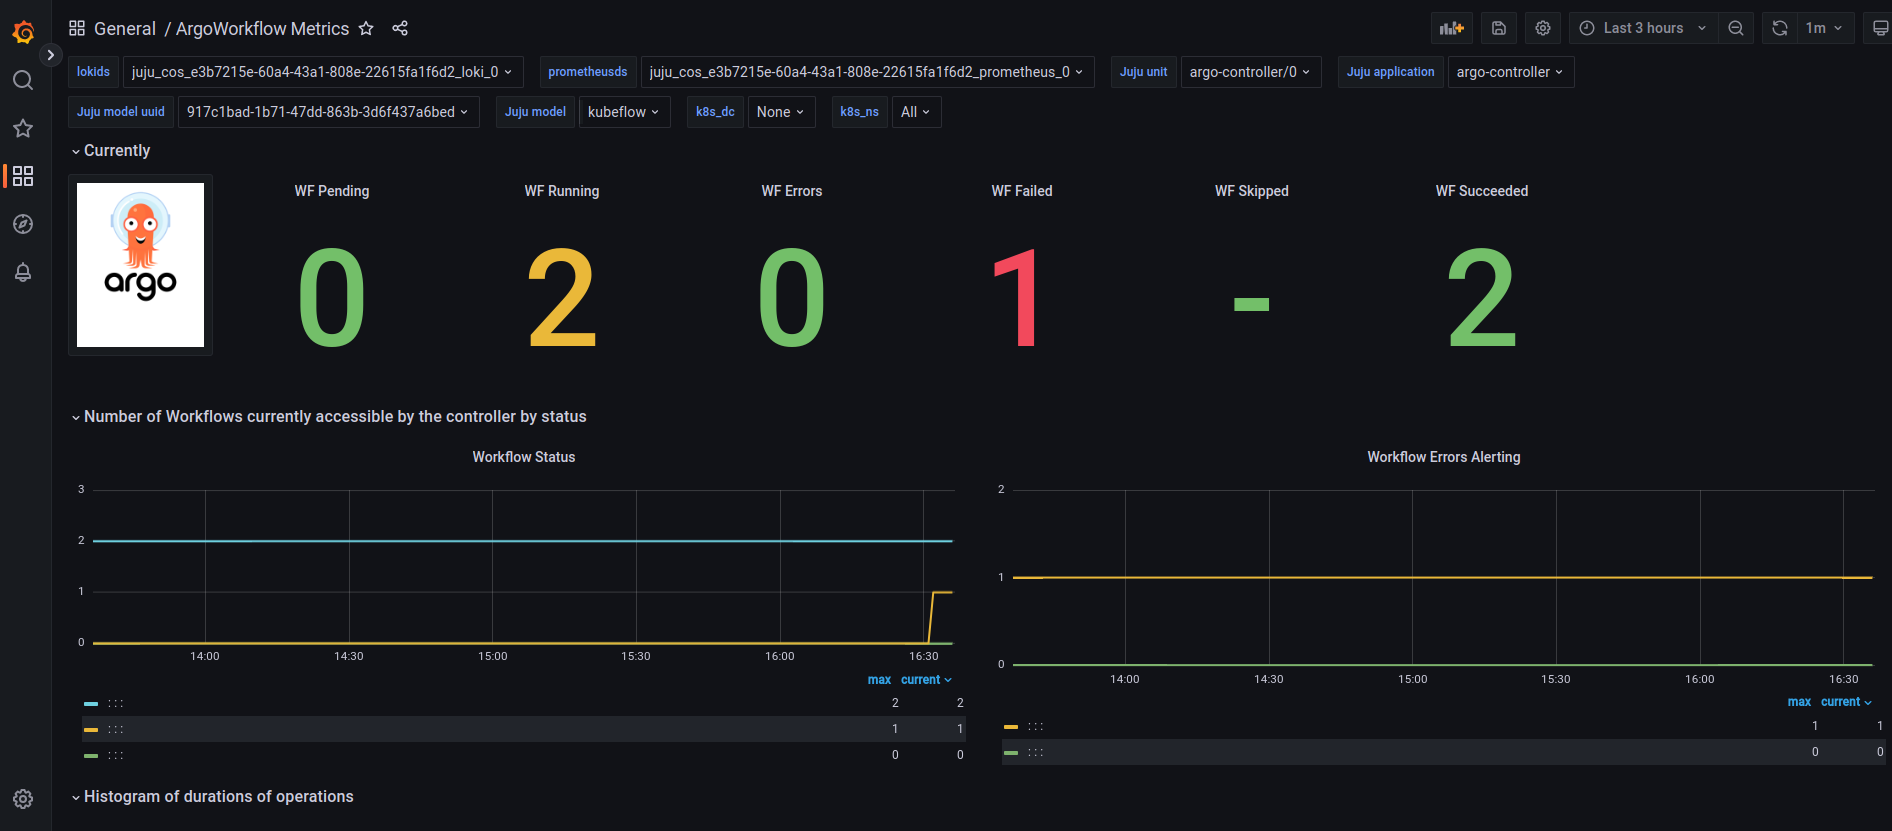
View metrics in ArgoWorkflow Metrics dashboard
Navigate to “ArgoWorkflow Metrics” dashboard. Locate Grafana filters at the top of the dashboard and select the following to see the metrics, if required:
-
Juju model =
kubeflow -
Juju application =
argo-controller
The following metrics are provided (scroll down to see more graphs):
- Number of workflows in error state
- Number of workflows in failed state
- Number of workflows in pending state
- Number of workflows in running state
- Number of workflows in succeded state
- Graph of number of workflow currently accessible by controller
- Graph of number of workflow errors alerting
- Histogram of workflow operation duration (not execution time)
- Graph of number of workflow queue adds
- Graph of depth of work queue
- Graph of time objects spent in the queue
- Graph of number of log messages
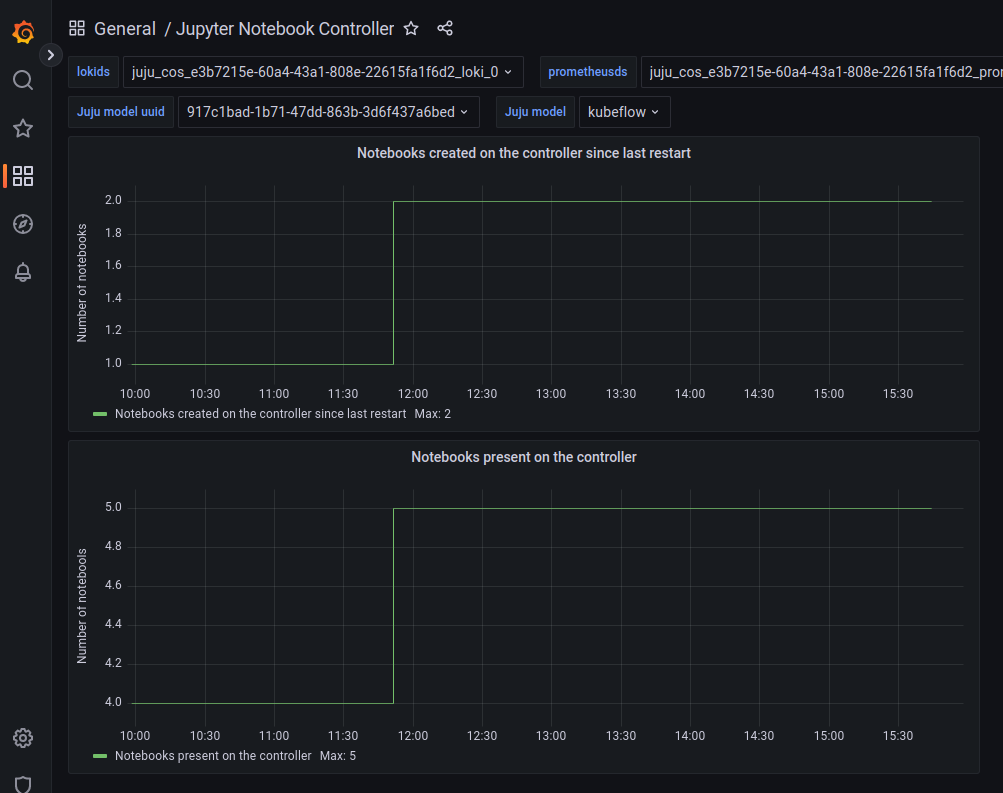
View metrics in Jupyter Notebook Controller dashboard
Navigate to “Jupyter Notebook Controller” dashboard. Locate Grafana filters at the top of the dashboard and select the following to see the metrics, if required:
-
Juju model =
kubeflow -
Juju application =
jupyter-controller
The following metrics are provided:
- Graph of number of notebooks created on the controller since last restart.
- Graph of number of notebooks present on the controller.
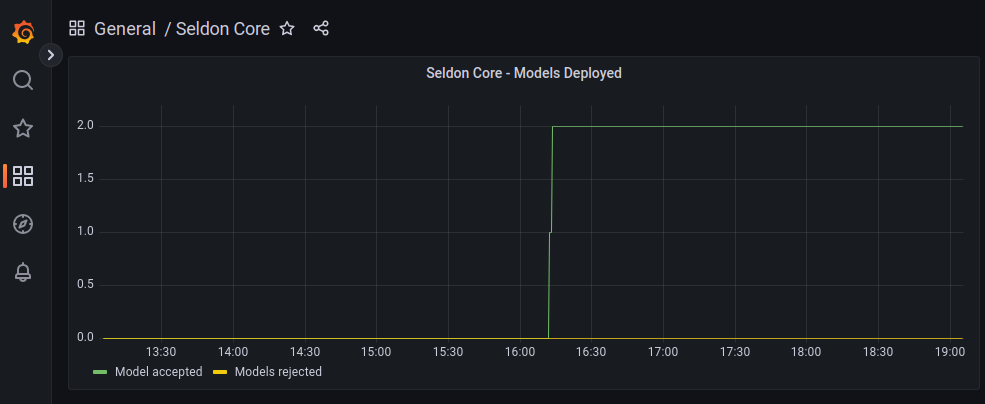
View metrics in View metrics in Seldon Controller Manager dashboard
Navigate to “Seldon Core” dashboard. Locate Grafana filters at the top of the dashboard and select the following to see the metrics, if required:
-
Juju model =
kubeflow -
Juju application =
seldon-controller-manager
The following metrics are provided and describe models deployed to Seldon Core:
- Graph of number of models rejected and accepted.